
I tried SRE as an Azure SRE for a service.
#SRGThe Service Reliability Group primarily provides comprehensive support for the infrastructure surrounding our media services, focusing on improving existing services, launching new ones, and contributing to open-source software (OSS).
This article briefly introduces how SRGs, which are horizontal organizational units, are shaping and maintaining an SRE culture within specific teams. We will also introduce materials used to explain these initiatives to the business side, as well as open-source software (OSS) used to foster the culture, so we hope this will be helpful in introducing SRE.
The goal of this article⚠ Before implementing SRESearch for Toil, etc.communicationEstablishing an incident response flow1. Discuss service quality with the business side.Documents used when explaining to the service provider2. Determine the Critical User Journey (CUJ).3. Determine SLI from CUJWhich metrics does SLI refer to?4. Write SLO queries.5. Target SLO/Window and Error BudgetAbout Target Window6. When the error budget runs out7. Promote SRE adoption through regular meetings, etc.Integrate SRE across the entire service.TipsHow can I get alerts for SLOs?Error budget burn rateIn conclusion
The goal of this article
This presentation will describe what SRG, a horizontal organization within our group, has done to build an SRE culture and improve service quality as part of its participation in the DotMoney service as an Embedded SRE (Site Reliability Engineer).
This article describes my personal approach, and it may not apply to many situations. Therefore, I hope you'll find it helpful as just another possible method.
⚠ Before implementing SRE
When I joined as an Embedded SRE, instead of immediately talking about SRE, I did various things to gain the trust of the service-side departments.
This was my first time as an SRE,Furthermore, the service provider may become exhausted before they can reap the benefits of SRE.The goal is to mitigate this somewhat by first establishing one's own credibility.
The first things I did were to reduce toilets and improve communication.
Search for Toil, etc.
Toil was discovered while we were trying to understand the service's infrastructure configuration and investigating the deployment flow.
for example,
- Completely unmaintained EC2 and IaC
- Wasted costs due to excessive resource allocation
- A time-consuming deployment flow
- There is no response procedure in case of an incident.
And so on
Since the purpose of this article is SRE, I will omit the details, but we were able to demonstrate clear, quantifiable results on the service side by migrating from EC2 to Fargate, addressing issues such as wasted costs due to excessive resource allocation, and improving the deployment flow.
communication
At DotMoney, we have daily server-side evening meetings and weekly company-wide meetings, so I attend those, actively review PRs for IaC, and (of course) handle incidents.
Establishing an incident response flow
Establishing an incident response flow and shortening the MTTR (Mean Time To Repair) is also one aspect of SRE, in order to ensure service quality.
And we must continue that culture.
The incident response flow documentation was outdated and the system wasn't operating according to that flow, so we established a new one from scratch, including the business flow.
Here, we have been working on things like implementing on-call services, establishing incident response flows, and using Datadog Incident to measure MTTR and operate post-mortems.
1. Discuss service quality with the business side.
Maintaining service quality is impossible without the cooperation of the business side.
In particular, it would be difficult to take any action after the error budget has been depleted without the product manager's permission.
Documents used when explaining to the service provider
This is the material used when explaining SRE at a general meeting that included engineers and business representatives from the service side.
I think it's difficult to get everyone to understand everything here. I doubt many people can grasp the concepts of SRE in just a few minutes after reading the documentation.
The goal of this meeting was to convey the concept of SRE (Site Reliability Engineering), which involves making service quality visible through the implementation of SRE, thereby providing information for business decision-making.
2. Determine the Critical User Journey (CUJ).
After giving you a general overview of SRE,The part with the biggest business impactWe will determine CUJ from this.
Instead of defining a large number of CUJs all at once, we decided on just one CUJ to start with.
Since DotMoney is a point exchange site, the biggest business impact is
User visits the site → Opens the product list page → Exchange is possible.
We defined this entire process as CUJ.
3. Determine SLI from CUJ
After determining the CUJ, we then look for SLIs, which serve as indicators for the SLOs.
This is also quite a difficult point.
Which metrics does SLI refer to?
Since DotMoney does not use Realtime User Monitoring (RUM), we do not use metrics from the frontend, and instead use logs from the load balancer closest to the user.
Conversely, using metrics from the front end is affected by the user's network environment, making it difficult to filter out outliers, and RUM is expensive everywhere. Therefore, if you're introducing SRE for the first time, it's easiest to use the metrics and logs from the load balancer closest to the user.
Ideally, if the correct data is used on the front end, it will be more reliable than metrics from load balancers and the like. This is because it can keep up with changes in service quality due to front-end implementations.
In the article "Learn how to set SLOs" published by Google SRE Cindy Quach, the example given is using load balancer (Istio) and does not involve front-end measurement.
The Google Cloud Architecture Center article provides detailed information on where to measure SLIs.
This article also states that client-side measurements contain many highly variable factors and are not suitable for triggering response-related events.
In many ways, with enough effort, it's certainly possible to measure performance on the front-end (client) side, but since this is my first time doing SRE, I decided to measure performance using the load balancer closest to the users for convenience.
4. Write SLO queries.
This CUJ (User visits the site → Opens the product list → Exchange is possible) is all"A normal response can be returned within 3 seconds."That is what they're saying.
Why 3 seconds?We investigated the response time before determining the SLO, and a good value that seemed achievable at the moment was 3 seconds.
In another of our services, we intentionally introduce delays in API responses to determine how much of a delay would negatively impact the user experience, based on our experience.
Let's take the Datadog query currently used by DotMoney when a user visits the homepage as an example.
Because DotMoney is frequently subjected to DoS attacks, we filter out requests related to DoS attacks and other suspicious requests.
Suspicious user agents and other factors change over time, so even though they don't actually affect service quality, the SLO (Service Level Objective) value keeps getting worse. Therefore, regular reviews and adjustments are necessary.
@http.status_code:([200 TO 299] OR [300 TO 399])5. Target SLO/Window and Error Budget
When we actually calculated the current SLO using the query in the previous section, we found that it is approximately 99.5%.
Therefore, I initially set all Target SLOs to 99.5%.
The Target SLO can be flexibly lowered or raised.
It's important to set an appropriate value initially and then review it regularly.
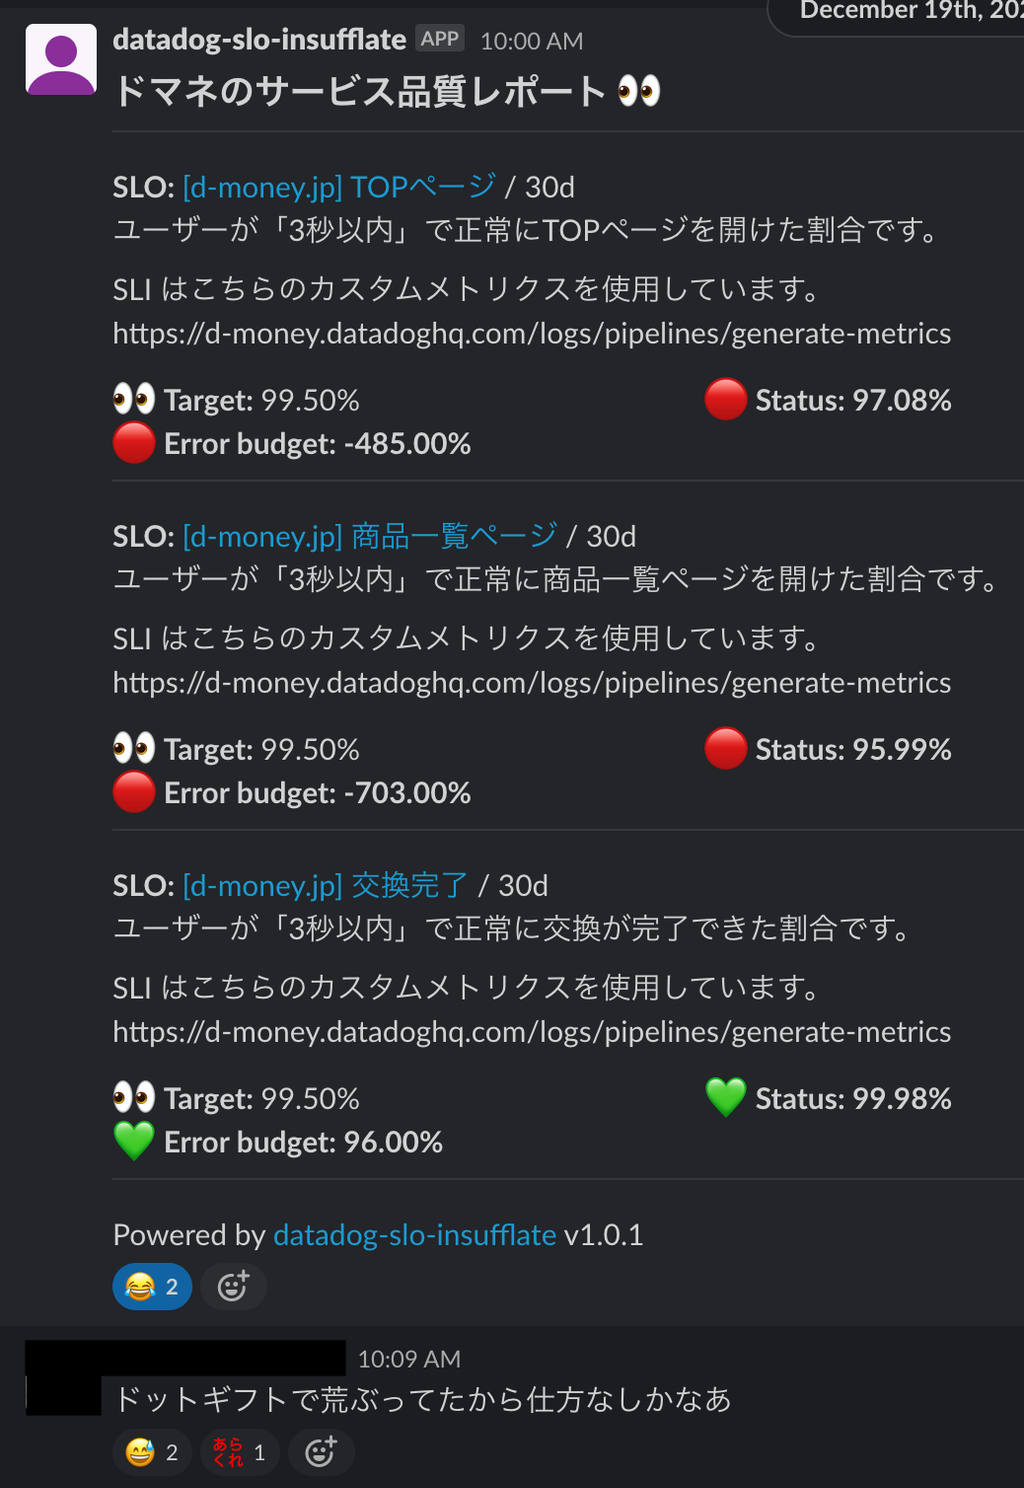
Note that having the error budget not consumed at this time is not ideal.

As you can see in the image above, the error budget on the SLO monitor that says "Replacement Complete" is completely gone.UnconsumedYou will notice this.
At first glance, the fact that the error budget hasn't been consumed might be commendable, but to put it another way, we can look at it differently as "Are they deploying infrequently?" or "Are they not undertaking any technical challenges?"
The error budget is the budget allocated to "technical challenges" against the Target SLO.
If you have excess error budget, tighten the Target settings to bring it to exactly 0% of the Target Window. Alternatively, increase the number of deployments to take on a technical challenge.
About Target Window
The Target Window is determined by the frequency of regular meetings and the development cycle.
While DotMoney itself is deployed approximately once a week, I decided that a 30-day Target Window would be best resource-wise since I am the only person participating in DotMoney as an Embedded SRE.
For example, if service deployments occur every Wednesday, setting the regular SLO meeting to Thursday and the Target Window to one week allows for discussions about changes in SLOs due to feature releases and error budgets.
Considering how things will behave when the error budget runs out (as explained in the next section), I think setting the Target Window to one week might be quite problematic.
6. When the error budget runs out
With the business side's agreement, DotMoney will explain how to handle situations when the error budget runs out.
"Except for responding to production failures, making improvements to restore reliability, and releasing features involving external companies, we will prohibit feature releases once the error budget is exhausted."
I decided to do that.

DotMoney has an exception in that there are situations where it is absolutely necessary to release information due to its relationship with external companies.
Furthermore, an exception is made if there are resources available to make modifications to restore reliability when prohibiting the release of a feature.
This will delay feature releases, but it will prevent features from becoming unavailable.
In fact, when the error budget was depleted, we were close to releasing a new feature, but DotMoney secured the resources of one engineer to restore reliability. So, two of us, including myself, worked on fixing the reliability while simultaneously releasing the new feature. I think our response to the error budget depletion was quite good.
7. Promote SRE adoption through regular meetings, etc.
SRE is an endless culture.
Once SRE is implemented, it's necessary to conduct regular retrospectives and integrate SRE into the service.
In our regular meetings, we not only check the error budget, but also review whether the SLIs are correct, whether the SLOs are too lenient or too strict, and reflect on what we've done so far.
The regular meetings I'm referring to here are the ones I belong to.SRGInstead of doing it that way, we'll work with Embedded SRE and engineers from DotMoney.Including the business sidepeopleWe will hold our regular meeting there.
The goal is to promote SRE by involving people from DotMoney.
Integrate SRE across the entire service.
When I was thinking about how to integrate SRE into the entire service, I realized that it would be quite difficult for those handling CS, front-end, and business-side tasks, as well as those participating in regular meetings.
So, I created a tool to post an SLO summary once a week to a random channel that everyone on the service side participates in.
datadog-slo-insufflateIt's available as a container image, making it easy to use.

The number of reactions is still small, but the number of people responding has increased compared to the beginning.
It's a tool that's better to have than not.
Speaking of failures, the SLO value was getting worse day by day.
Then one day, a major failure occurred.
Because we hadn't yet implemented the error budget burn rate, which I'll discuss later in the Tips section, we couldn't anticipate it, but we learned that if the SLO value keeps getting worse, it will eventually lead to a major crash.
Tips
How can I get alerts for SLOs?
We have not set up any alerts for SLOs this time, and we do not plan to set any in the future.
This is because we have set up alerts for the error budget burn rate, which will be explained later.
Error budget burn rate
Burn rate is a term coined by Google that represents a unitless value indicating how quickly the error budget is consumed relative to the target length of an SLO (Service Level Objective). For example, if the target is 30 days, a burn rate of 1 means that, at a constant rate, the error budget will be completely consumed in exactly 30 days. A consumption rate of 2 means that, at a constant rate, the error budget will be depleted in 15 days, and a consumption rate of 3 means that it will be depleted in 10 days.
The Datadog documentation provides a clear explanation of burn rate.
This error budget burn rate allows you to set up alerts directly on the error budget, eliminating the need to set up alerts on the SLO.
Furthermore, it can also eliminate alerts for 5xx error rates, which tend to generate noise alerts, making it a win-win situation.
Here's what the alerts I've actually set up in DotMoney look like.
burn_rate("").over("30d").long_window("1h").short_window("5m") > 14.4message
Since it's not possible to set both `short_window` and `long_window` simultaneously via a web query, I configured them using Terraform (API). The settings may be configured by the time this article is published.
The reason for setting them simultaneouslyUsing only `short_window` would result in frequent alerts and create noise, so adding `long_window` to the condition reduces noise and makes the results more reliable.
In conclusion
This article was essentially a firsthand account of how I, a beginner in SRE, implemented SRE for a service.
Implementing SRE can seem daunting, but I think it's important to just give it a try.
Of course, SRE is both a culture and an organization, so it's not a case of "it's done" just because it's been implemented; the story is far from over.
I don't fully understand SRE myself, but I think the quickest way to gain knowledge about it is to implement it without overthinking it at first and then improve it day by day. (Because it's often mundane work with an unclear outlook...)
What I've been thinking about latelyVisualizing the link between SRE and business impactI want to do this.
For example, I want to visualize the difference between sales revenue when the error budget is depleted and becomes negative, and sales revenue when the error budget is used efficiently (or even has a surplus), and determine how to do that. I want to transform the vague idea that SRE has a real impact on the business into a reality.
If anyone is already doing this, please let me know!
SRG is looking for new team members.
If you are interested, please contact us here.