
The story of how the Performance Schema was the cause of a worsening error rate in Aurora MySQL, even though the load on the system hadn't increased.
This is Yuta Kikai (@fat47) from the Service Reliability Group (SRG) of the Media Division.
#SRGThe Service Reliability Group primarily provides comprehensive support for the infrastructure surrounding our media services, focusing on improving existing services, launching new ones, and contributing to open-source software (OSS).
This article describes a case study of how we handled an Aurora MySQL outage that occurred one day.
One day, an alert was suddenly triggered regarding a worsening error rate in the application.Initial investigationI found one blog post.Investigate the Performance Schemaroot causeInitial responseIn conclusion
One day, an alert was suddenly triggered regarding a worsening error rate in the application.
One day, the application's error rate suddenly worsened, triggering an alert.
Initial investigation
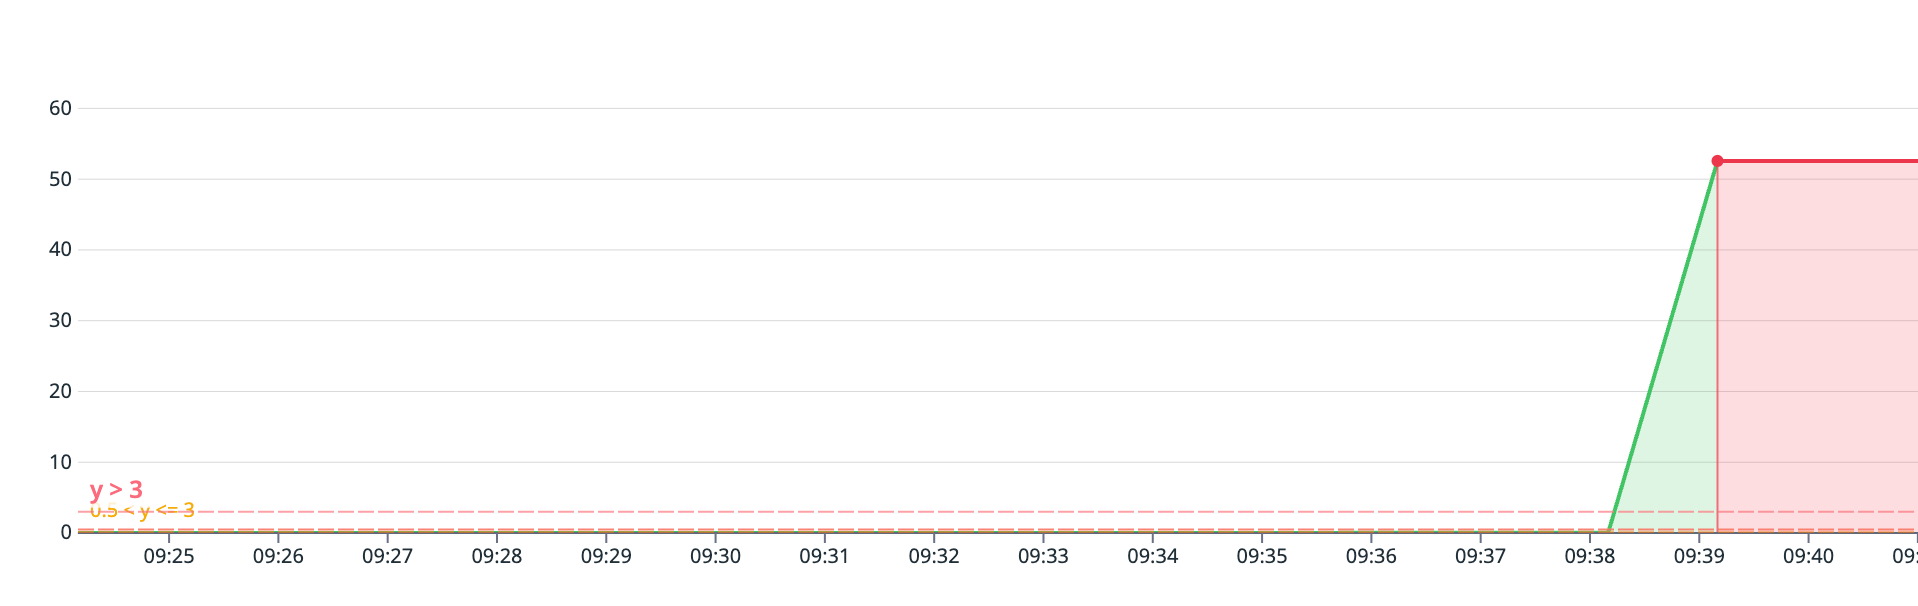
Upon checking the error logs of the Aurora MySQL RDS instance during that time, the following logs were found:
It appears that Aurora MySQL was closing connections or rejecting queries to avoid OutOfMemory Errors (OOMs) caused by insufficient memory.
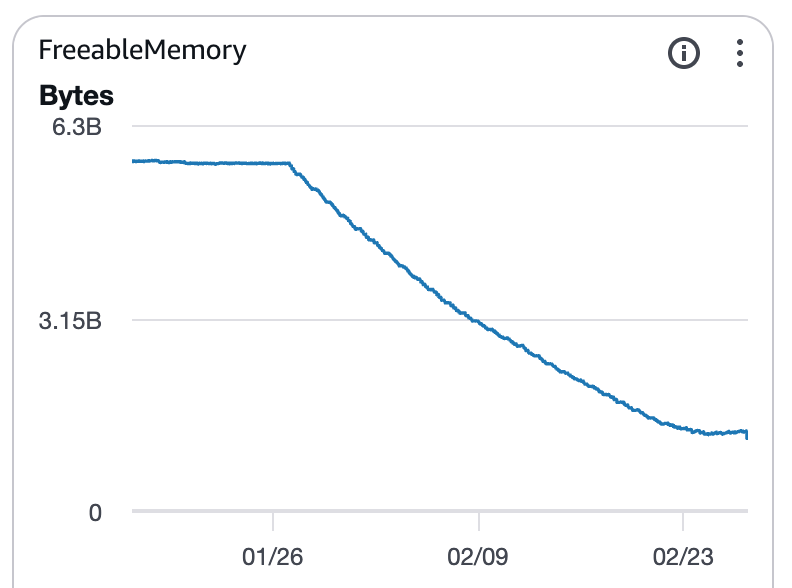
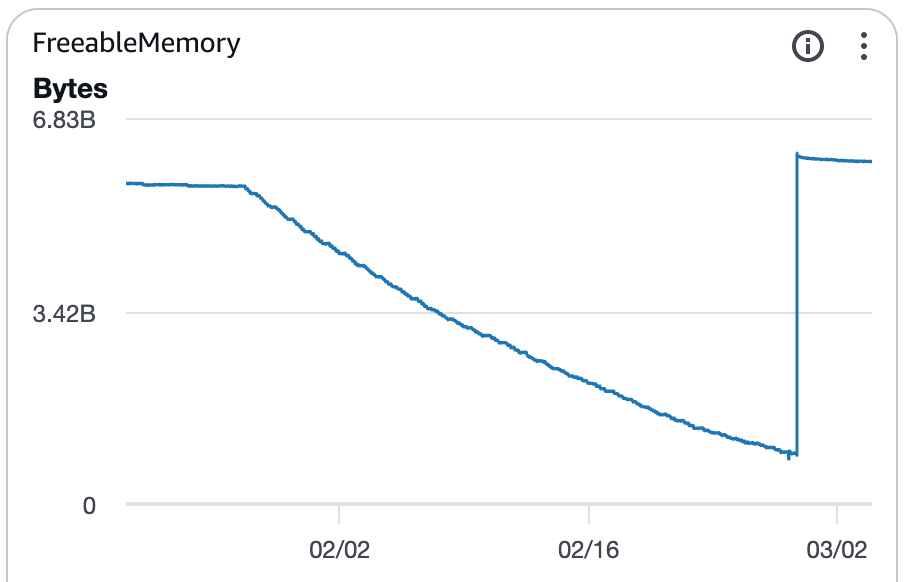
Upon checking the metrics, I noticed that FreeableMemory started to decline steadily from a certain day onward.
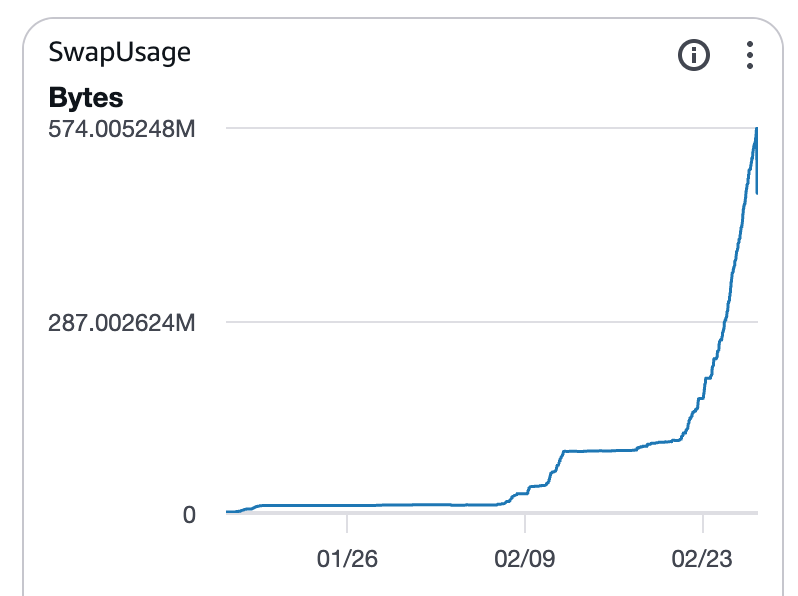
SwapUsage is also increasing with a time lag.
I'll check for any other changes in metrics related to database load. CPU usage doesn't seem to have changed significantly over a one-month period.
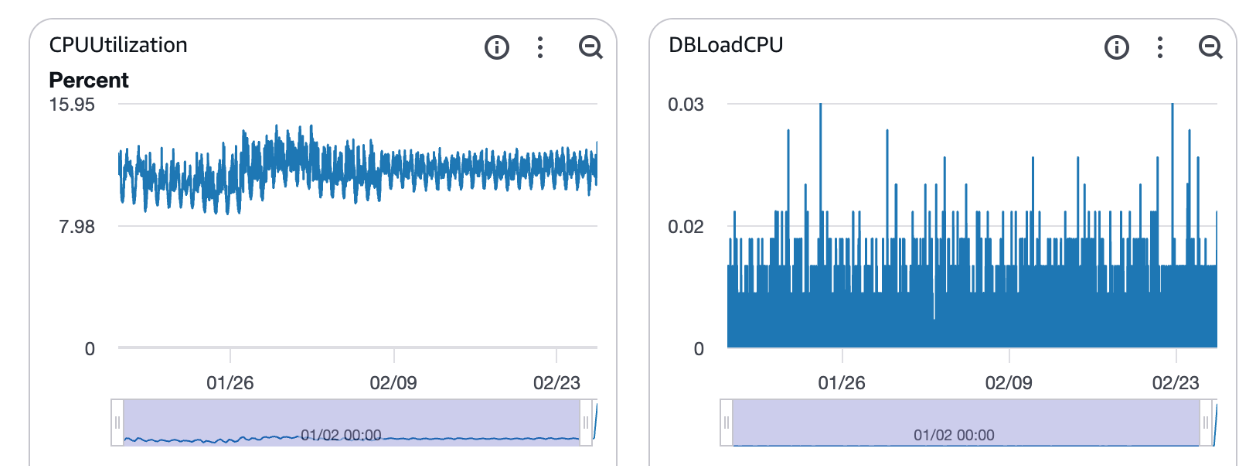
Looking at the average active sessions (AAS) for the past week using Database Insight, it doesn't seem to have worsened. There were also no slow query logs.
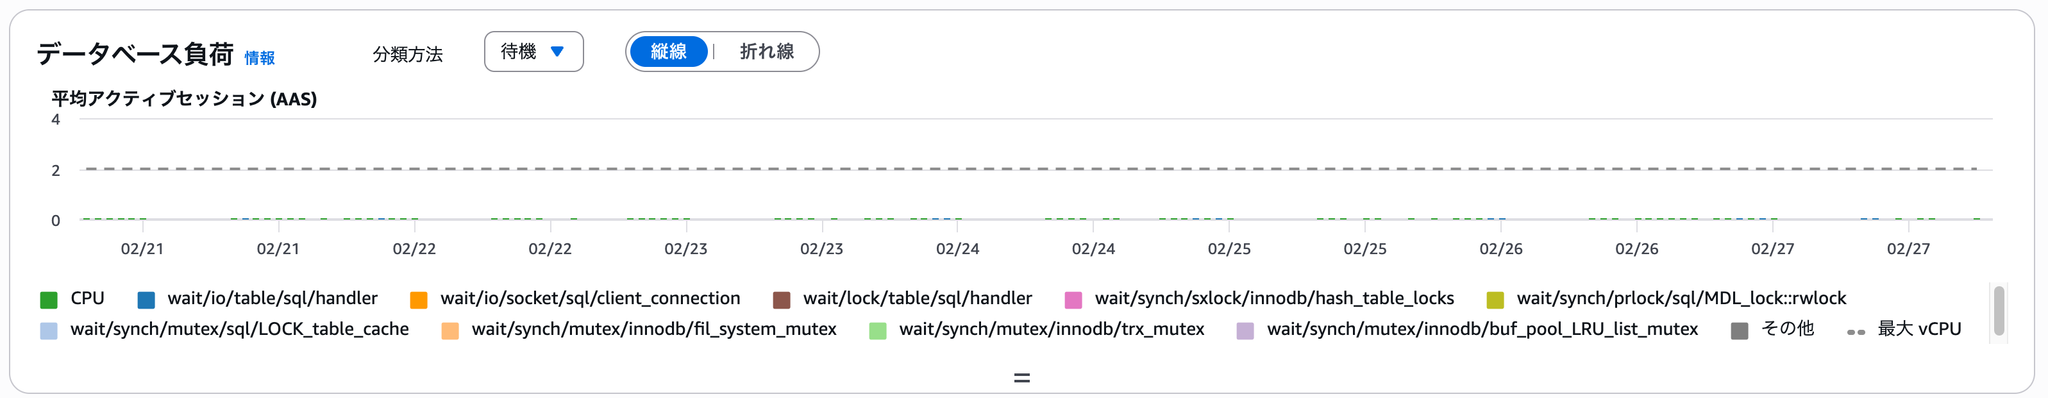
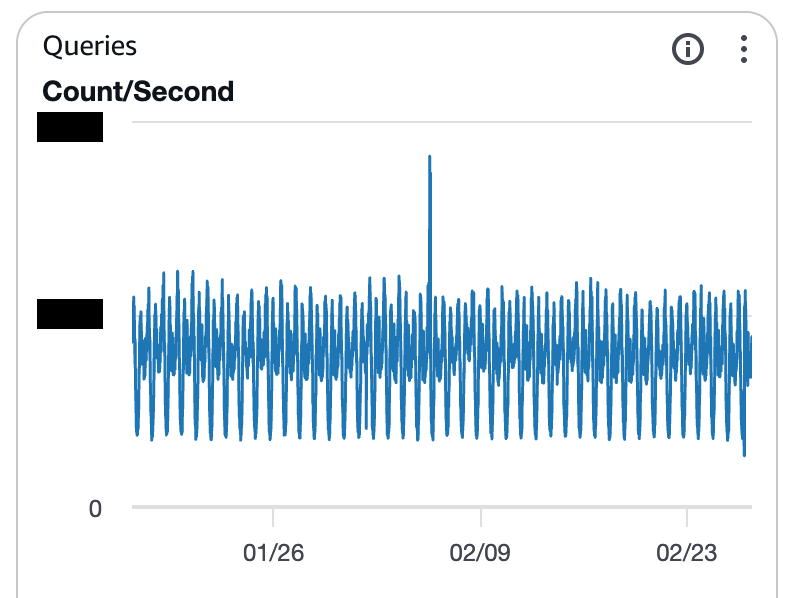
There doesn't seem to be any change in the trend of the number of queries.
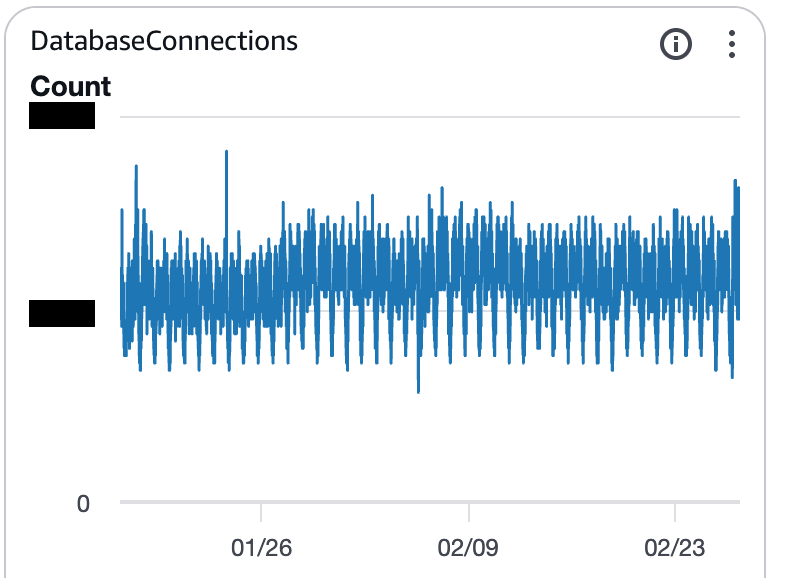
There has been no change in the trend of the number of connections.
It appears that the decline in FreeableMemory is related to the release of a new application feature on the same day.
However, I was wondering what to do since no metrics other than memory congestion were increasing.
I found one blog post.
In this article by AndpadPerformance Schema is causing a decrease in FreeableMemory.This phenomenon was described.
In the examples in the articleUpgrading from Aurora MySQL 3.04 (MySQL 8.0.28) to 3.10 (MySQL 8.0.42) changed the default behavior of certain instances.That was the cause.
The environment I was working with this time was Aurora MySQL 3.04, so it wasn't exactly the same issue as described in this article, but the contributing factors were...The Performance Schema seems suspicious.So, we investigated.
Investigate the Performance Schema
Upon checking the overall memory usage in Performance Schema, we found that it was consuming approximately 5.2GB.
The current value and the maximum usage value match, indicating that consumption is still increasing.
Upon examining the breakdown of memory consumption, it became clear that the host/account-specific summary was the dominant component.
If you count the number of hosts/accounts,Approximately 16,000 itemsI found out that there are each.
Upon examining the contents of the `accounts` file, I found a large number of unique source HOST entries, each recorded with a different IP address.
root cause
In the application release on the day when Freeable Memory began to decrease,A batch process that runs every minute using Kubernetes CronJob has been added.It has come to light that...
performance_schema.accountsThe number of summaries also increased, causing the memory consumption of the Performance Schema to become bloated.
As a result, Freeable Memory continued to decrease, Swap Usage increased, and eventually Aurora exhibited OOM avoidance behavior, leading to query kills and worsening application latency.
Initial response
I changed the following parameters in the Aurora MySQL parameter group.
| Parameter name | Default value | Changed value |
|---|---|---|
| 0 (automatic management) | 1 (manual management) | |
| -1 (Unlimited) | 100 | |
| -1 (Unlimited) | 100 |
performance_schema_accounts_sizeThese two are unlimited by default, which is why they ended up accumulating indefinitely, as happened in this case.
Please note that restarting the RDS instance is required for these parameter changes to take effect.
This solution resolved the issue of the declining FreeableMemory usage and the occurrence of SwapUsage.
performance_schema_accounts_size
In conclusion
I presented an example where, even though a system alert was triggered, database load metrics remained stable, suggesting that a bloated Performance Schema might be a cause for concern.
This time, we resolved the issue by setting upper limits for two performance_schema-related parameters.
Another approach is to use an RDS Proxy between the application and Aurora MySQL to stabilize the source HOST connection.
If you are interested in SRG, please contact us here.