My experience as an intern at Ameba Platform, where I worked on setting up monitoring for Istio, Karpenter, and AWS LBC.
nice to meet you.
My name is Sota Tonegawa, and I am a third-year student in the Faculty of Commerce at Keio University.
From March 4th to March 30th, I participated in CyberAgent's "CA Tech JOB" internship program, working in the Service Reliability Group (SRG) of the Media Division.
#SRGThe Service Reliability Group primarily provides comprehensive support for the infrastructure surrounding our media services, focusing on improving existing services, launching new ones, and contributing to open-source software (OSS).
During this internship, I worked with the Ameba platform team on setting up monitoring on Datadog for key components such as Istio, Karpenter, and AWS Load Balancer Controller.
This article will introduce the background of the monitoring system development, the design policy, the implementation process, and the insights gained during the actual implementation.
Why was monitoring and maintenance necessary?Current challengesWhat will change with improved monitoring systems?Roadmap for monitoring infrastructure developmentSTEP 0: First, determine the priority of the components.Common PolicyPrioritization resultsSTEP 1: Establish a workload health monitoring system.The concept of surveillanceDaemonSet needed a different perspective.Strategies to avoid increasing the number of monitors too much.Datadog query exampleWhat we learned in STEP 1STEP 2: Establish individual component monitoring.Karpenter monitoringKey metricsReason for selectionOperational supplementary informationIstio monitoringKey metricsReason for selectionResults of investigations in real-world environmentsThe monitoring perspective that was ultimately adoptedOperational supplementary informationMonitoring AWS Load Balancer ControllerKey metricsReason for selectionMetrics that were omitted this timeThings we focused on in this initiative1. First, set up common monitoring.2. Avoid picking up noise.3. Monitoring is not a self-contained process.Future initiativessummaryIn conclusion
Why was monitoring and maintenance necessary?
A platform running on Kubernetes is made up of numerous components working together.
However, without a mechanism to continuously monitor whether these components are functioning correctly, failures will have to be reported by users or discovered by chance.
Current challenges
At the time, the platform already had dashboards automatically generated by Datadog integrations such as ArgoCD and FluxCD.
However, the information was not well-organized for practical use, and it was difficult to say that it was being utilized for fault detection or initial troubleshooting.
Furthermore, there was a risk that we might not be able to immediately notice if the following problems occurred.
- If the system stops: When the Pod restarts, the sidecar is unable to retrieve its configuration, resulting in gradually unstable inter-service communication.
- If Karpenter stopsNew nodes will no longer be added, the number of Pending Pods will continue to increase, and the service will become unable to scale.
- If the AWS Load Balancer Controller stopsLoad Balancer target updates and propaganda processes stop, and changes on the Kubernetes side are no longer reflected in external communications.
What will change with improved monitoring systems?
| perspective | Before maintenance | After maintenance |
|---|---|---|
| Fault detection | It's not apparent until a user reports it or someone accidentally notices it. | Failures can be detected with alerts. |
| Predictive detection of failures | none | It can detect deterioration and abnormal trends in advance. |
| Troubleshooting speed | It starts with error investigation. | Assuming a Runbook is in place, we can start addressing the issue immediately. |
| visibility | low | The state of each component can be continuously monitored. |
The purpose of improving monitoring systems is not simply to increase the number of alerts.
"Being able to notice things," "Being able to start troubleshooting," "Things that can be improved through operation"I thought it was important to have them all together.
Roadmap for monitoring infrastructure development
This initiative has been designed to be implemented in stages, divided into the following steps.
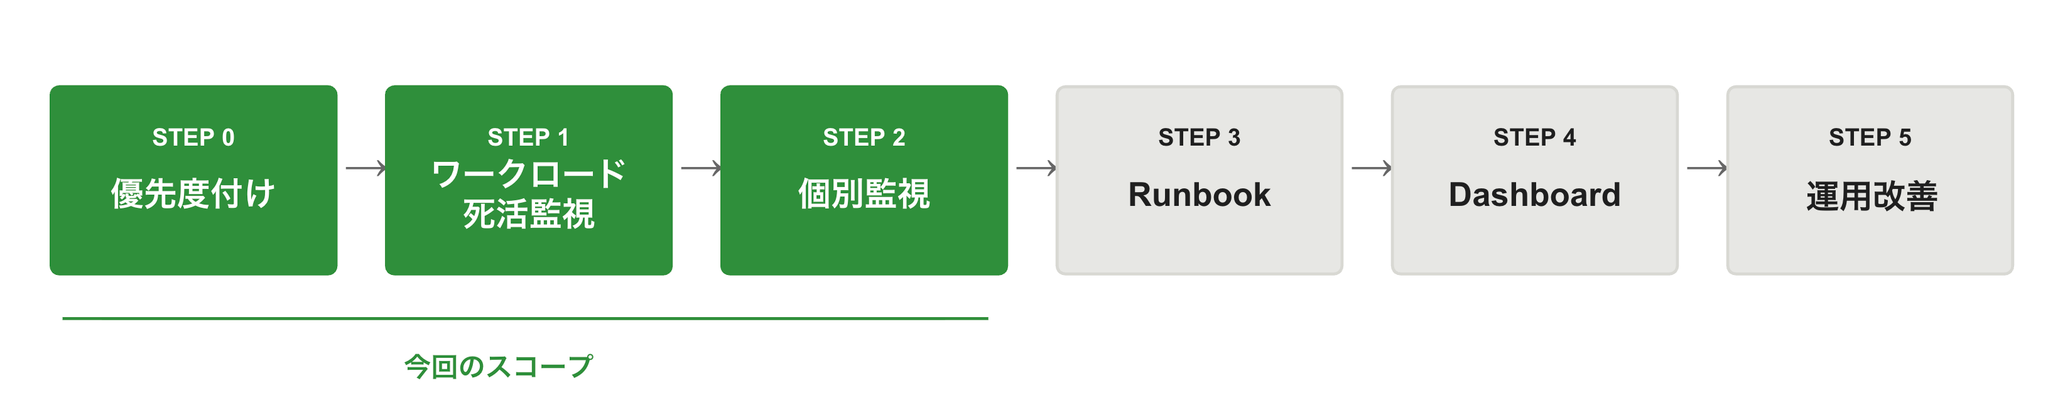
During this internship period, we will focus on Steps 0 and 2, in particular.Istio / Karpenter / AWS Load Balancer ControllerWe worked on improving the monitoring system.
STEP 0: First, determine the priority of the components.
Since the internship period is limited, I first needed to decide "where to start."
Furthermore, since the priority definition directly affects the notification level in subsequent alert design, we decided to finalize the overall policy first.
Common Policy
Prioritization was determined based on the following two axes:
- Importance: Magnitude of impact × Speed at which the impact occurs
- systemType of failure (downtime / degradation)
Based on that, we defined the following common rules for P1 to P4.
* The thresholds and evaluation windows shown here are for reference only, as they may vary depending on the operation and cluster characteristics.
| Importance | system | standard | conditions | level |
|---|---|---|---|---|
| P1 | Hard down | Immediate and widespread impact | This continues for 1 minute. | critical |
| P1 | Degraded | It won't stop immediately, but continuing will be dangerous. | This continued for 10 minutes. | warn |
| P2 | Hard down | Impact expected in the relatively near future | This continues for 1 minute. | warn |
| P2 | Degraded | Continuing this will lead to significant consequences. | This continued for 10 minutes. | warn |
| P3 | Hard down | There is a limited but significant impact on service disruption. | This continues for 1 minute. | warn |
| P3 | Degraded | Deterioration continues | This continued for 10 minutes. | warn |
| P4 | Hard down | The immediate impact is minimal. | This continues for 1 minute. | warn |
| P4 | Degraded | Problems arise from prolonged neglect. | This continued for 10 minutes. | warn |
Prioritization results
The components classified as P1 are those whose downtime has a significant impact and whose effects become apparent relatively quickly.
| component | subcomponents | Actual workload name | Workload | Hard down | Degraded | Main effects of stopping |
|---|---|---|---|---|---|---|
| Istio | istiod(stable) | Deployment | 1 minute → critical | 10 minutes → warn | New Pod sidecar settings will no longer be received. | |
| Karpenter | controller | Deployment | 1 minute → critical | 10 minutes → warn | New Nodes will no longer be added. | |
| AWS LBC | controller | Deployment | 1 minute → critical | 10 minutes → warn | LB targets will no longer be updated. |
These three were treated as the top priority targets for monitoring during this internship.
STEP 1: Establish a workload health monitoring system.
The first thing we did was to implement the following that can be applied to all components in common.Workload-level health monitoring is.
Before looking at individual metrics, it was necessary to ensure that we could reliably detect whether the component was even alive in the first place.
The concept of surveillance
We defined the following two types of alerts for each workload type:
- Hard down: A state that can be considered almost completely stopped.
- Degraded: Some replica shortages and reduced coverage are dangerous if they continue.
The following is the basic approach for deployment/StatefulSet:
available = 0
desired > available
desired > availableDaemonSet needed a different perspective.
In DaemonSet, a simple "insufficient number of replicas" like in Deployment doesn't fully represent the actual situation.
Since it makes sense for each node to be running, what you should look at isready / rapid coverage is.
For example, Fluent Bit and Datadog Agent are components that are assumed to be widely deployed across all nodes.
Therefore, there is a significant difference in meaning between "one unit dropped" and "a 20% drop."
Therefore, DaemonSet employs a two-stage monitoring approach using ratios.
ready / desired < 0.5
ready / desired < 0.8
* The thresholds and evaluation windows shown here are for reference only, as they may vary depending on the operation and cluster characteristics.
ready / desiredStrategies to avoid increasing the number of monitors too much.
Dividing the monitoring into detailed categories based on priority, system, and workload will drastically increase the number of items to manage.
Therefore, this time,System × Workload TypeWe designed it with this as the basic unit, and separated the hard down of P1 as a critical component.
As a result, we created the following seven types of monitors:
- Deployment / Hard down / P1 critical
- Deployment / Hard down / non-P1 warn
- Deployment / Degraded / warn
- StatefulSet / Hard down / warn
- StatefulSet / Degraded / warn
- DaemonSet / Hard down / warn
- DaemonSet / Degraded / warn
This division allowed us to maintain our notification policy while keeping the number of operational monitors low.
Datadog query example
For the P1 Deployment Harddown, we used the following query:
The evaluation criteria are as follows:
- Evaluate the minimum
- Evaluate in the last minute of the rolling window.
- Firing occurs when the evaluation value falls below 1.
Furthermore, the Degraded state of StatefulSet is viewed as the difference between desired and ready states.
What we learned in STEP 1
At this stage, we have at least created a state where we can "notice that the main components have stopped working."
On the other hand, this alone is not enoughWhy does it seem like it's about to stop?、In which direction is it deteriorating?I can't see that far.
Next, we moved on to individual monitoring tailored to the specific characteristics of each component.
STEP 2: Establish individual component monitoring.
With individual monitoring, the goal was to capture "signs of failure before it stops" or "dangerous conditions even if it hasn't stopped" for each component.
The three main things we focused on this time were:
- Karpenter
- Istio
- AWS Load Balancer Controller
Karpenter monitoring
Karpenter is a component responsible for node lifecycle management in Kubernetes clusters.
If it's not working correctly, nodes won't be added even if the number of Pending Pods continues to increase, and the service won't be able to scale out.
Therefore, in addition to workload health monitoring,Is the node addition delayed / has it failed?Individual monitoring was necessary to capture this information.
We used this as a reference during our research.
Key metrics
This time, we have selected the following four items as our main monitoring targets.
| Metrics | Target of surveillance |
|---|---|
| Time from Pod creation to Running | |
| Pods waiting to be scheduled are backed up. | |
| Cloud provider API call error | |
| Reconcile error within the controller |
Reason for selection
Anomalies in Karpenter can be broadly viewed from the following three perspectives:
- Is the scaling slow as a result?
- Is there a backlog of nodes waiting to be added?
- Is the process failing due to an external or internal factor?
Therefore, we mapped the metrics as follows:
karpenter.pods.startup.time_seconds.quantile
karpenter.provisioner.scheduling.queue_depth
karpenter.cloudprovider.errors.count
karpenter.controller.runtime.reconcile_errors.count
Operational supplementary information
nodeclaimnotfounderrorTherefore, we actually added exclusion conditions to the monitoring process as follows:
Thus, instead of simply looking at the number of errors,To enable the detection of only meaningful anomalies in actual operation.I was conscious of that.
Istio monitoring
Istio is a component that provides a service mesh.
If the Control Plane (ISTIOD) stops working or if there are problems distributing xDS settings, it may affect inter-service communication.
However, under the current operation, Istio is primarily used on the Ameba platform.Topology understanding and distributed tracingIt is used for that purpose, and its primary focus is not on communication control based on mTLS.
Therefore, this time, we will not broaden the scope of monitoring too much.Health monitoring of the Control Plane (istiod)We focused on that and proceeded accordingly.
We used this as a reference during our research.
Key metrics
Initially, we selected the following metrics as candidates for monitoring:
| Metrics | Target of surveillance |
|---|---|
| internal XDS processing error in istiod | |
| Number of times the proxy rejected the XDS configuration | |
| XDS response transmission timeout count | |
| Delay from configuration change to completion of application to each proxy | |
| Push queue congestion | |
| Number of sidecar injection failures |
Reason for selection
We believe that anomalies in the Istio Control Plane can be primarily identified from the following perspectives:
- Has the xDS distribution itself failed?
- Is there a delay in the settings being applied?
- Is there a problem with the sidecar injection?
For each of these, we have organized the candidate metrics as follows:
istio.pilot.total_xds_internal_errors
istio.pilot.total_xds_rejects
istio.pilot.xds.write_timeout
istio.pilot.proxy_convergence_time
proxy_convergence_time
istio.sidecar_injection.failure_total
Results of surveys in real-world environments
On the other hand, as we continued our investigation, we found that some metrics defined in the documentation and code were not being collected in the actual environment.
For example, see below.
istio.pilot.total_xds_internal_errors
istio.pilot.total_xds_rejects
istio.pilot.xds.write_timeout
istio.sidecar_injection.failure_total
/metricsFrom this survey,Error metrics may not be exposed to the Prometheus endpoint if no events have occurred.I understand now.
In other words,
- The code has a definition.
- It is also included in the documentation.
/metrics
That was the situation.
The monitoring perspective that was ultimately adopted
Following these results,Metrics that cannot be acquired are excluded from primary monitoring, and the minimum effective monitoring is constructed from the metrics that can actually be acquired.We have changed our policy.
Ultimately, the following are the primary targets for monitoring at this time:
| Metrics | Target of surveillance | remarks |
|---|---|---|
| Delay from configuration change to completion of application to each proxy | Main targets of surveillance | |
| Push queue congestion | Use as a supplement as needed. |
Regarding certificate-related metrics, we lowered their priority because we are not using mTLS in this case.
Operational supplementary information
istio.pilot.proxy_convergence_timeOn the other hand, through the delay in setting changes,An unsettling state that precedes a problemIt has the advantage of being easier to capture.
However, depending on the environment, the value may temporarily jump, and setting a strong alert suddenly could create noise.
Therefore, this time
- First, visualize it.
- See the distribution under normal conditions
- Understanding the boundary between noise and anomalies.
- Then, it will be turned into an alert.
We decided to proceed in that order.
Monitoring AWS Load Balancer Controller
The AWS Load Balancer Controller (LBC) is a crucial component that connects Services/Ingress on Kubernetes with AWS Load Balancer resources.
If this is not working correctly, even if you make changes on the Kubernetes side, the creation and updating of ALB/NLB will not proceed.
Therefore, in addition to workload health monitoring,Individual monitoring to detect failures in communication with AWS and anomalies in the admission route.It was necessary.
We used this as a reference during our research.
* AWS Load Balancer Controller's proprietary metrics are available from version 2.13 onwards, therefore the monitoring design in this article assumes version 2.13 or later. LBC-specific metrics are not available in earlier versions.
Key metrics
| Metrics | Target of surveillance |
|---|---|
| Reconcile Error within LBC | |
| AWS API Throttling | |
| AWS API permission error | |
| AWS API service limit exceeded | |
| AWS API Validation Error | |
| webhook validation failed | |
| webhook mutation failure |
Reason for selection
LBC abnormalities can be broadly divided into the following three categories.
- LBC's own internal error
- AWS API limitations and anomalies
- Admission webhook route failure
Therefore, instead of looking at a single error counter,In which segment are they failing?I've made it possible to view them separately.
for example,
awslbc_reconcile_errors_total
aws_api_call_permission_errors_total
aws_api_call_service_limit_exceeded_errors_total
awslbc_webhook_mutation_failures_total
This makes it easier to isolate problems by category.
Metrics that were omitted this time
The following were also considered as metrics useful for performance analysis and detailed investigation:
awslbc_reconcile_stage_duration
aws_api_call_duration_seconds
awslbc_top_talkers
However, these are more like primary monitoring.
- Detailed analysis after ignition
- Identifying where the slowness is occurring
- Identifying noisy resources
It is suitable for.
Therefore, this timePrioritize metrics that directly lead to anomaly detection.These have been compiled as candidates for future visualization and operational improvements.
Things we focused on in this initiative
In setting up this monitoring system, we didn't simply "collect metrics and set up alerts," but instead focused strongly on the following points:
1. First, set up common monitoring.
Before proceeding with individual monitoring, we first established a minimum detection network by setting up health checks for Deployments, StatefulSets, and DaemonSets.
This ensured that even components without individual monitoring capabilities could be detected in case of a complete shutdown.
2. Avoid picking up noise.
When developing monitoring systems, preventing false alarms and excessive alerts is just as important as reducing missed detections. Too many alerts can lead to alert fatigue, potentially causing us to miss truly important anomalies. Therefore, in this design, we focused not only on detecting anomalies but also on adjusting thresholds and evaluation windows to ensure operationally sustainable alerting.
3. Monitoring is not a self-contained process.
Ultimately, the design needs to include how the system will behave when an alert is triggered.
Therefore, we plan to develop runbooks and dashboards to connect monitoring to our operations.
Future initiatives
After completing STEP 1 and STEP 2 (Istio, Karpenter, and AWS Load Balancer Controller), we plan to proceed with the following:
- STEP 2.5: Individual monitoring of other components Deployment to components used in the Ameba Platform, such as cert-manager, ESO, and HNC
- STEP 3Runbook creation Establishment of verification and response procedures when an alert is triggered.
- STEP 4Dashboard creation Understanding normal trends and visualizing abnormal signs
- STEP 5Improvement through operation: PDCA cycle Threshold adjustment, noise reduction, expansion of target area
summary
In this internship, starting from a state where platform component monitoring was not adequately established, I first designed and implemented workload health monitoring, and then worked on individual monitoring of Istio, Karpenter, and AWS Load Balancer Controller.
What was particularly impressive was that the monitoring design was not simply about selecting metrics,
- What to prioritize
- To what extent should primary monitoring be conducted?
- What metrics can actually be obtained?
- How to reduce noise and alert fatigue
This involved design work that took the entire operational process into consideration.
I realized that monitoring isn't a one-time thing; it requires continuous improvement through actual operation, reviewing the validity of thresholds, refining runbooks, and understanding trends through dashboards.
We hope that this initiative will lead to faster detection and response to outages on the Ameba Platform.
In conclusion
Thank you to everyone who reviewed my work and offered advice during my internship.
Monitoring may seem like a mundane task, but I felt it was the very foundation that supports stable operation.
Starting with what we've implemented this time, I hope to continue developing our monitoring system to enable us to "notice," "isolate," and "improve" issues in the future.
If you are interested in SRG, please contact us here.