
Automated recovery workflows that leverage alert descriptions as dynamic runbooks.
Hasegawa from the Service Reliability Group (SRG) of the Media Management Division (@rarirureluis)is.
#SRGThe Service Reliability Group primarily provides comprehensive support for the infrastructure surrounding our media services, focusing on improving existing services, launching new ones, and contributing to open-source software (OSS).
CyberAgent Group SRE Advent Calendar 2025This is the article for day 17.
This article examines a system that uses AI to interpret Grafana alert descriptions and automatically generates recovery commands, introducing a method for achieving flexible incident response while reducing the effort required for script maintenance.
The hostnames and alerts mentioned in this article are personal and not related to the company I belong to.
This time,GrafanaAlert function, workflow automation tooln8n,and AIBy combining these elements, we verified a mechanism that interprets the description included in the alert and automatically generates and executes recovery commands.
Background and ObjectivesArchitecture and MechanismsProcessing flowImplementation and Verification1. Register the n8n Webhook as an alert destination in Grafana.2. Add an alert routing policy.3. Setting up Grafana alerts2. Building an n8n workflowWebhook contentVerifying the operation of the AI Agent NodeExecute command3. Operation VerificationDiscussion and future challengessummary
Background and Objectives
Typically, when automating disaster recovery (auto-remediation), it's common practice to associate specific scripts or Ansible Playbooks with each alert.
However, this method requires developing and maintaining scripts every time the number of alert types increases.
So this time, we'll look at the alert settings in Grafana.DescriptionLeave it as isRunbook (Procedure Manual)We tried an approach of "treating it as such."
We will verify whether a flexible automated recovery flow can be achieved by having AI interpret recovery procedures written in natural language and generate and execute appropriate Linux commands on the spot.
Grafana alerts can also specify a runbook (URL), and it's possible to fetch this using n8n, but this time we'll use the description.
Architecture and Mechanisms

The configuration of the testing environment is as follows:
- GrafanaMonitoring and alerting.
In the Description field, write the recovery procedure in natural language.
- n8nReceive alerts via webhooks and control your workflow.
- AI (LLM)This uses AI tools on n8n (such as LangChain nodes) to generate Linux commands to be executed based on the contents of the Description.
- Target ServersThis is the environment in which the generated command will be executed.
Processing flow
- Grafana detects the anomaly and issues an alert.
- An alert notification (Webhook) is sent to n8n.
This payload includes a description.
- n8n receives the webhook and extracts the text from the Description field.
- The AI agent on n8n reads the Description and generates "Linux commands to perform this procedure".
- n8n executes the generated commands on the target server (or via SSH).
- Check the execution results and consider the recovery complete.
Implementation and Verification
1. Register the n8n Webhook as an alert destination in Grafana.
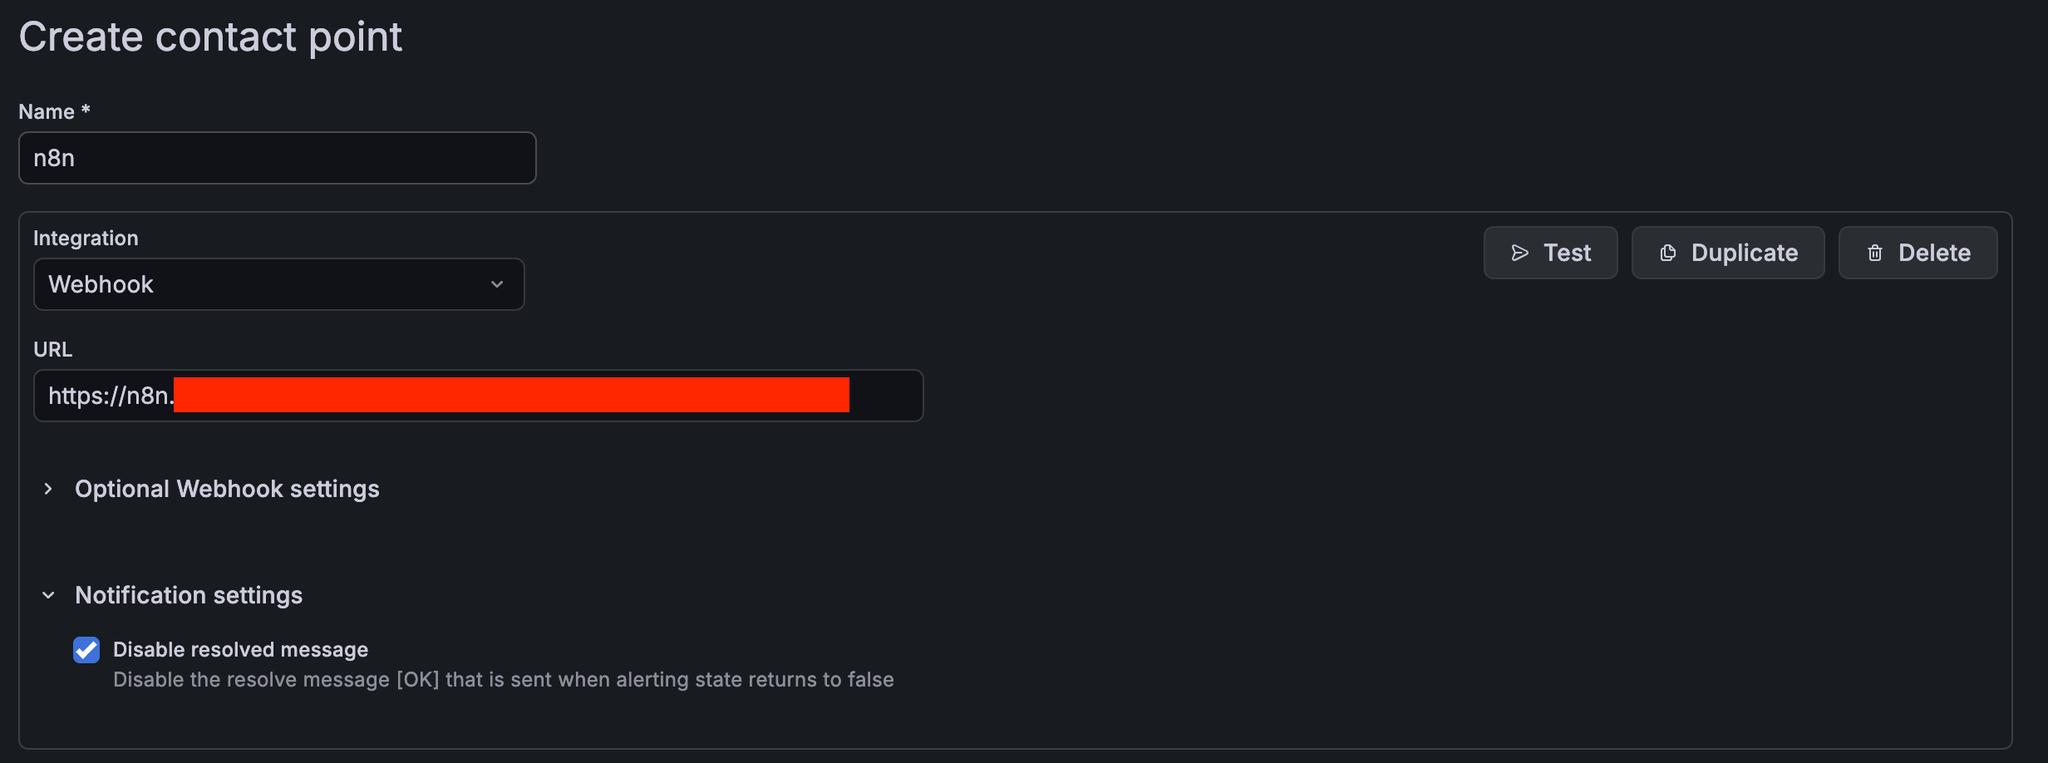
2. Add an alert routing policy.
n8n = true
3. Setting up Grafana alerts

First, create an alert rule in Grafana.
The key point here is,Summary or DescriptionThis involves describing specific recovery procedures that will serve as instructions for the AI.
For example, in the case of a web server process monitoring alert, you would write it as follows:
- Alert Name: Nginx Down
- Description:
In this way, you should write down "what to check and how to deal with it" in English (or Japanese).
This will become the dynamic Runbook.
We will also add labels to match the routing policy mentioned earlier.

Preview routing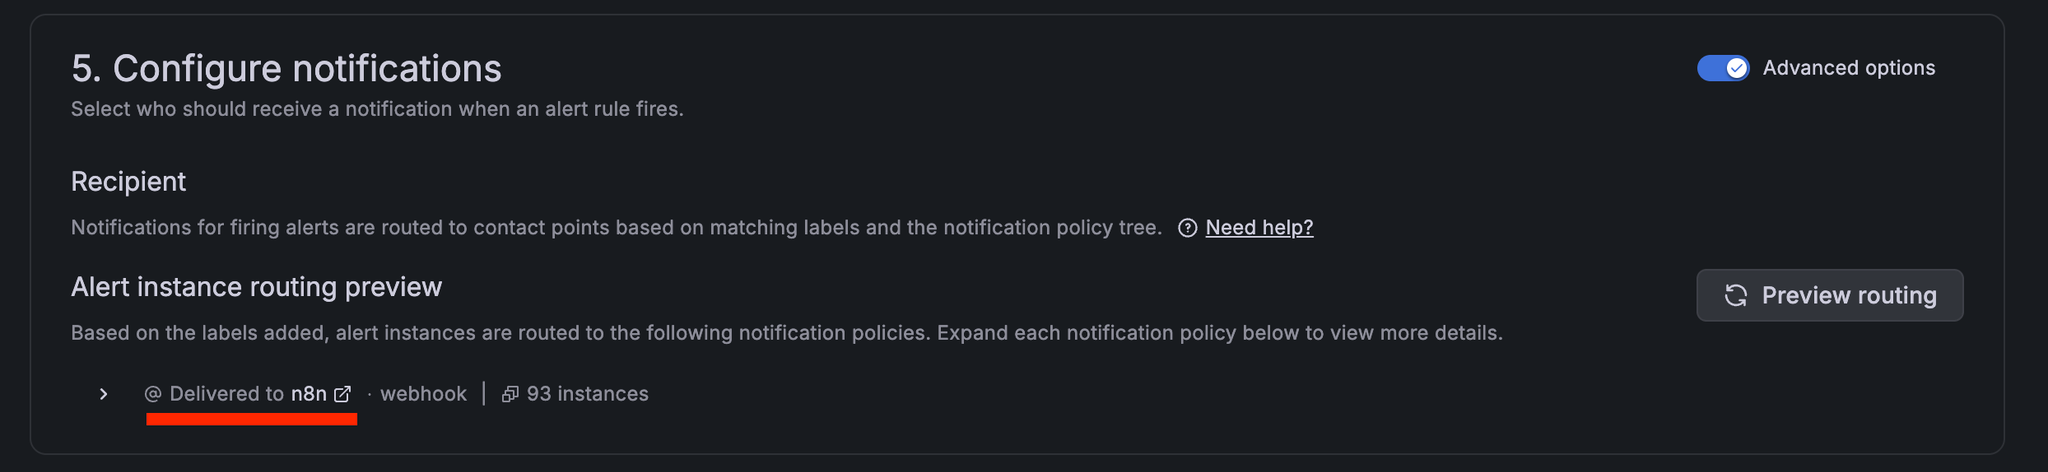
2. Building an n8n workflow

On the n8n side, we created a workflow with the following node configuration.
- Webhook Node: Receives POST requests from Grafana.
{{ $json.body.alerts[0].annotations.description }}- Full prompt
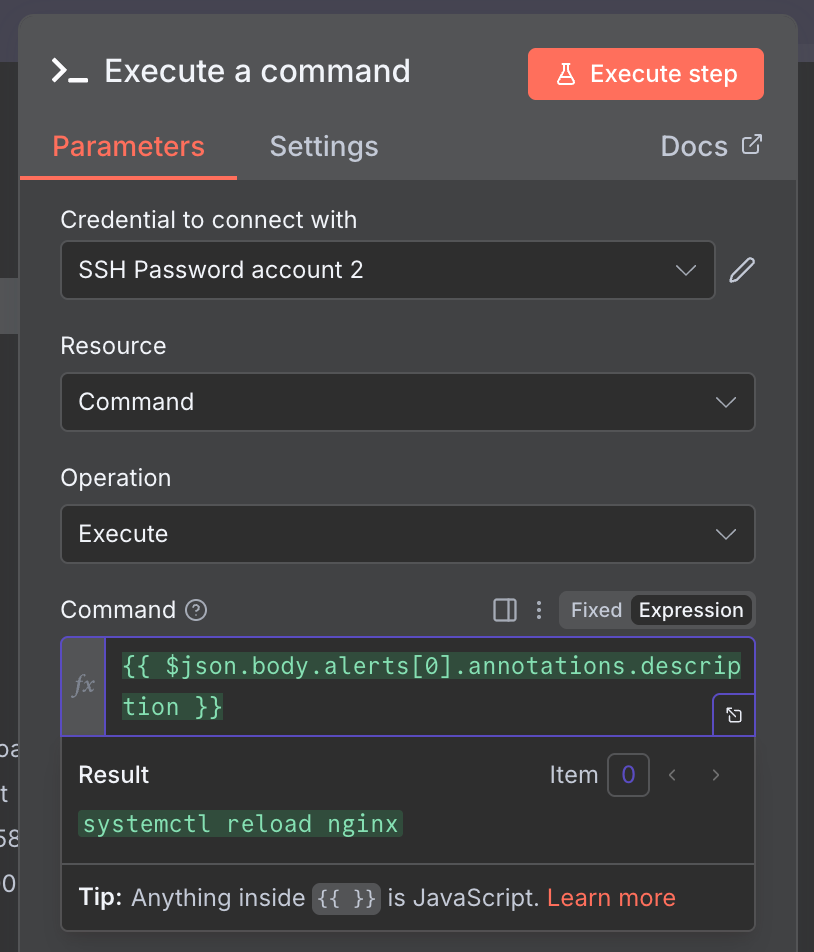
- Execute Command Node: Receives the commands output by the AI and executes them on the server (sometimes using an SSH node).
Webhook content

Verifying the operation of the AI Agent Node

The left pane is for input, the middle is the AI Agent Node settings screen, and the right pane is the AI Agent Node output.
systemctl restart nginxContents of the prompt after variable expansion

Execute command
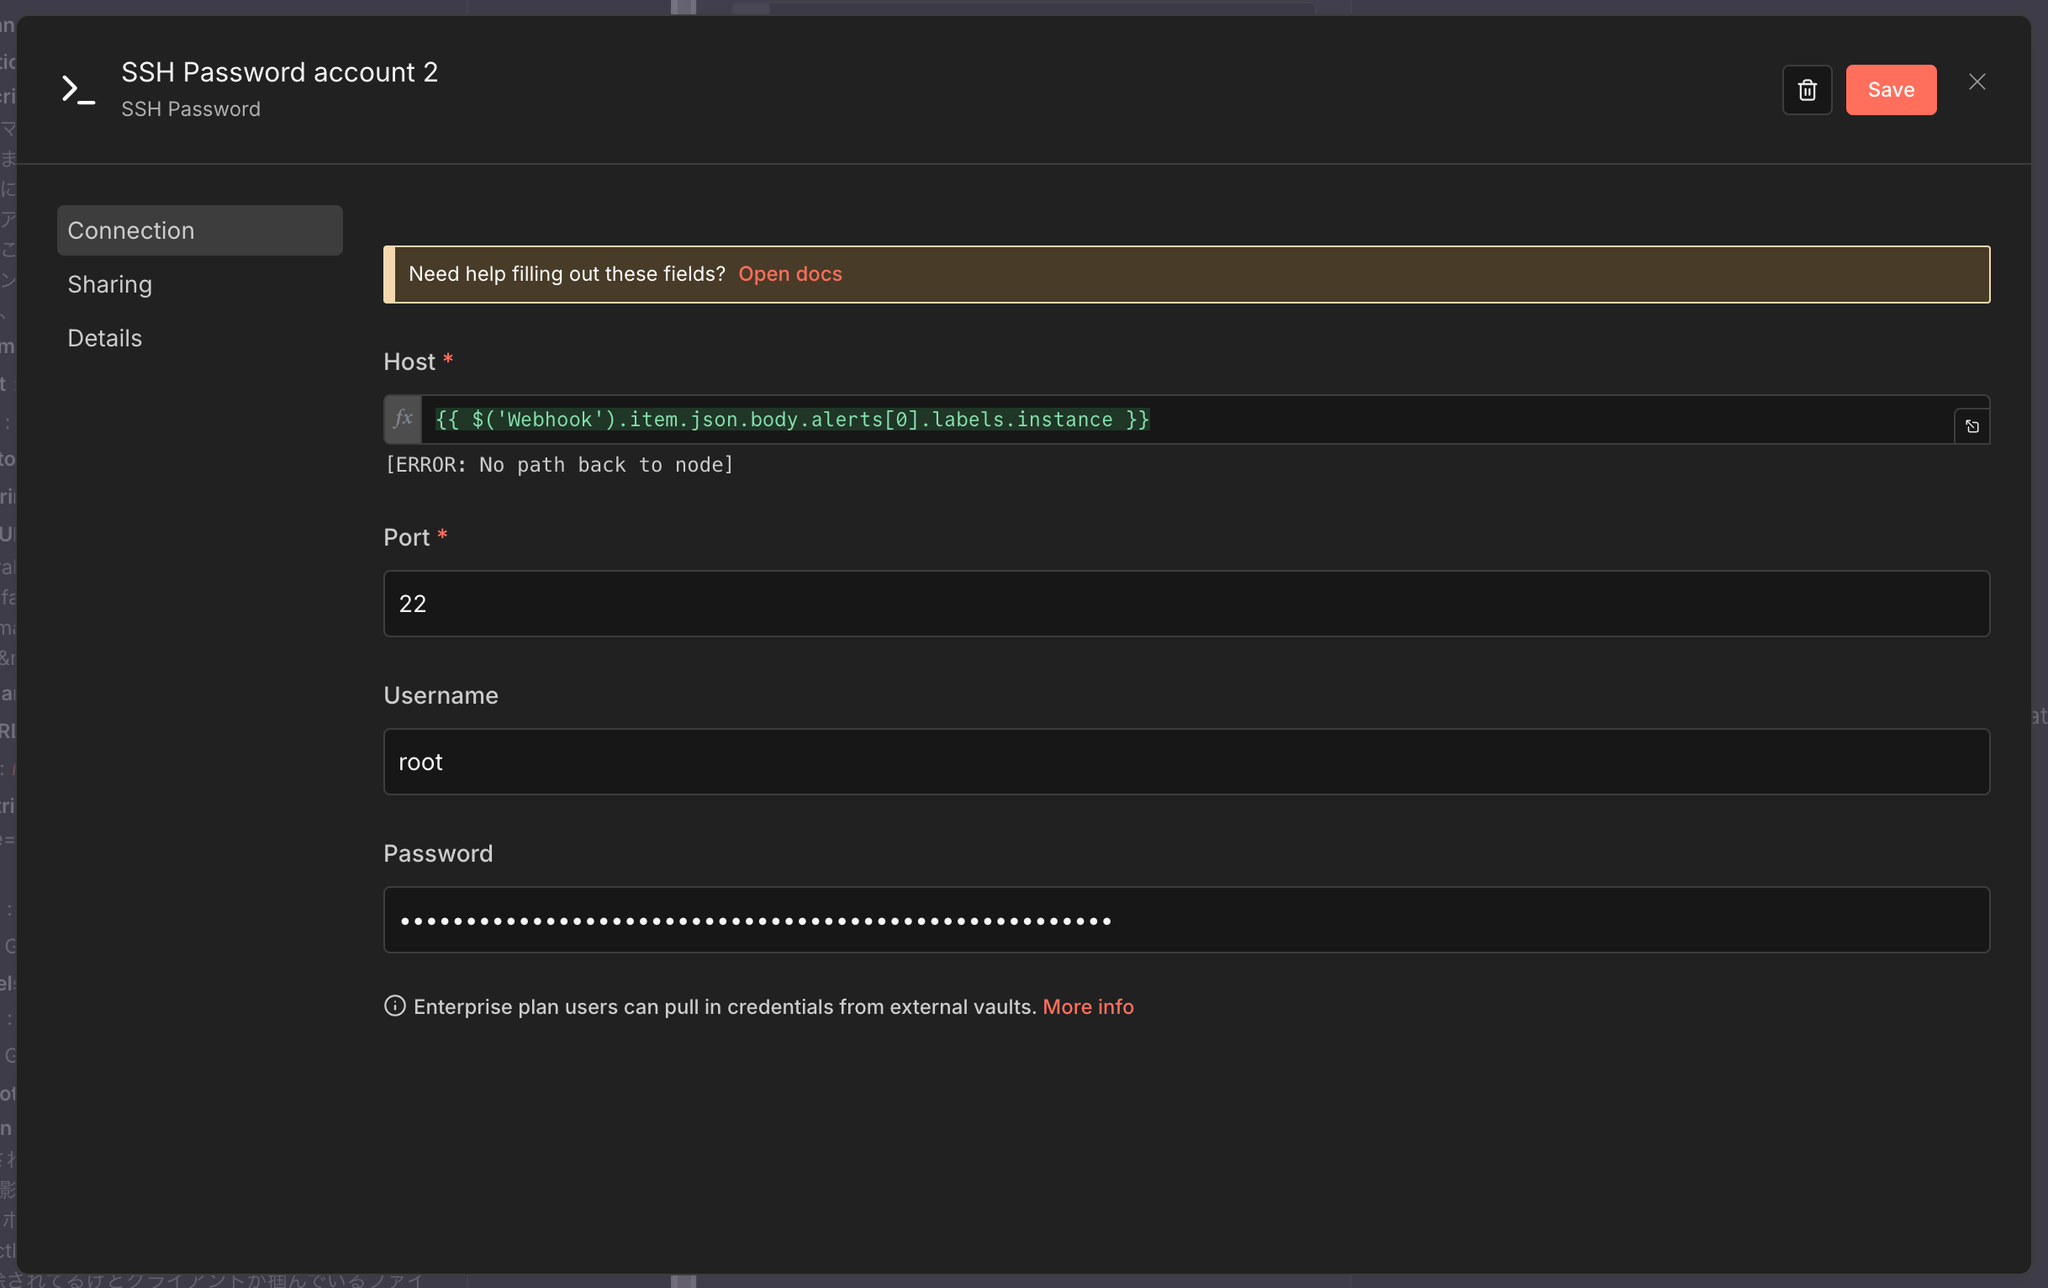
The machine you're SSHing to can also be used dynamically.
This specifies the instance within the label received via the webhook.
All that's left is to call the command output by the AI Agent Node using a variable, and you're done.
3. Operation Verification
I actually tried triggering an alert in Grafana.
- Alert issuedGrafana detects the downtime and sends a webhook to n8n.
- AI analysisThe AI on n8n reads the Description and generates a command.
- Automatic recovery: n8n executes the above command.
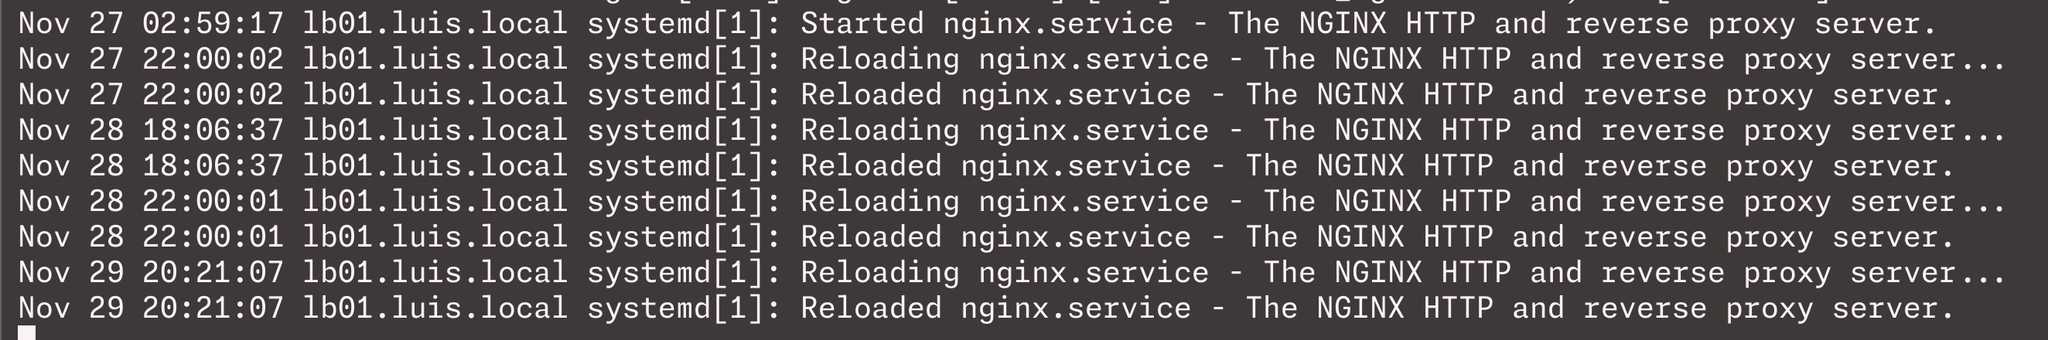
Afterward, I confirmed that Nginx had restarted.
The verification results confirmed that recovery behavior can be controlled simply by rewriting the Grafana Description, without needing to prepare a fixed script in advance.

Discussion and future challenges
This verification shows that「Description = Runbook」We found that this configuration is technically possible.
This approach has the following advantages:
- Improved maintainabilityIf you want to change the recovery logic, you only need to modify the alert description in Grafana, rather than modifying the code.
- Elimination of reliance on individual expertiseBecause the procedures are clearly documented and executed automatically, there is no discrepancy between the documentation and the actual process.
On the other hand, several challenges have also become apparent regarding practical implementation.
- Safety (risk of hallucination)There is a risk that the AI may inadvertently generate destructive commands (e.g., data deletion).
To implement this in a production environment, you'll need safeguards such as "only allowing read-only commands" and "requiring human approval via Slack before execution."
- Access controlUser privileges for executing commands from n8n must be appropriately restricted.
summary
By combining Grafana, n8n, and AI, we were able to build an automated recovery workflow that leverages alert descriptions as dynamic runbooks.
The approach of having AI generate commands has the potential to dramatically streamline routine operational tasks.
Going forward, we plan to further investigate the design of safer execution flows and their application to complex fault response scenarios.
SRG is looking for new team members.
If you are interested, please contact us here.