[New Feature] Automated Incident Response Verification and Points to Note Using AWS DevOps Agent
This article is written entirely by a human.
This is Yuta Kikai (@fat47) from the Service Reliability Group (SRG) of the Media Management Division.
#SRGThe Service Reliability Group primarily provides comprehensive support for the infrastructure surrounding our media services, focusing on improving existing services, launching new ones, and contributing to open-source software (OSS).
This document summarizes the results of our testing of the DevOps Agent announced at re:Invent 2025.
What is AWS DevOps Agent?Steps to try using the DevOps Agent0. Preparation1. Create a DevOps Agent Space2. Instruct the DevOps Agent to conduct an investigation.Current considerations for the DevOps Agent1. The scope of the DevOps Agent is limited to investigating the root cause of failures, proposing recovery measures, and suggesting preventive measures; executing recovery or preventive measures commands is outside its scope.2. Usage during the preview period is free, but there are limitations.3. In its initial state, the system will not initiate an investigation unless you issue a request for it from the DevOps Agent's UI screen.4. Differences in the monitoring service provider's response status5. We cannot investigate the contents of the EC2 server.In conclusion
What is AWS DevOps Agent?
DevOps Agent is a new feature announced at re:Invent 2025 that is an AI agent capable of identifying the root cause of failures from metrics and logs, and proposing mitigation and preventative measures.
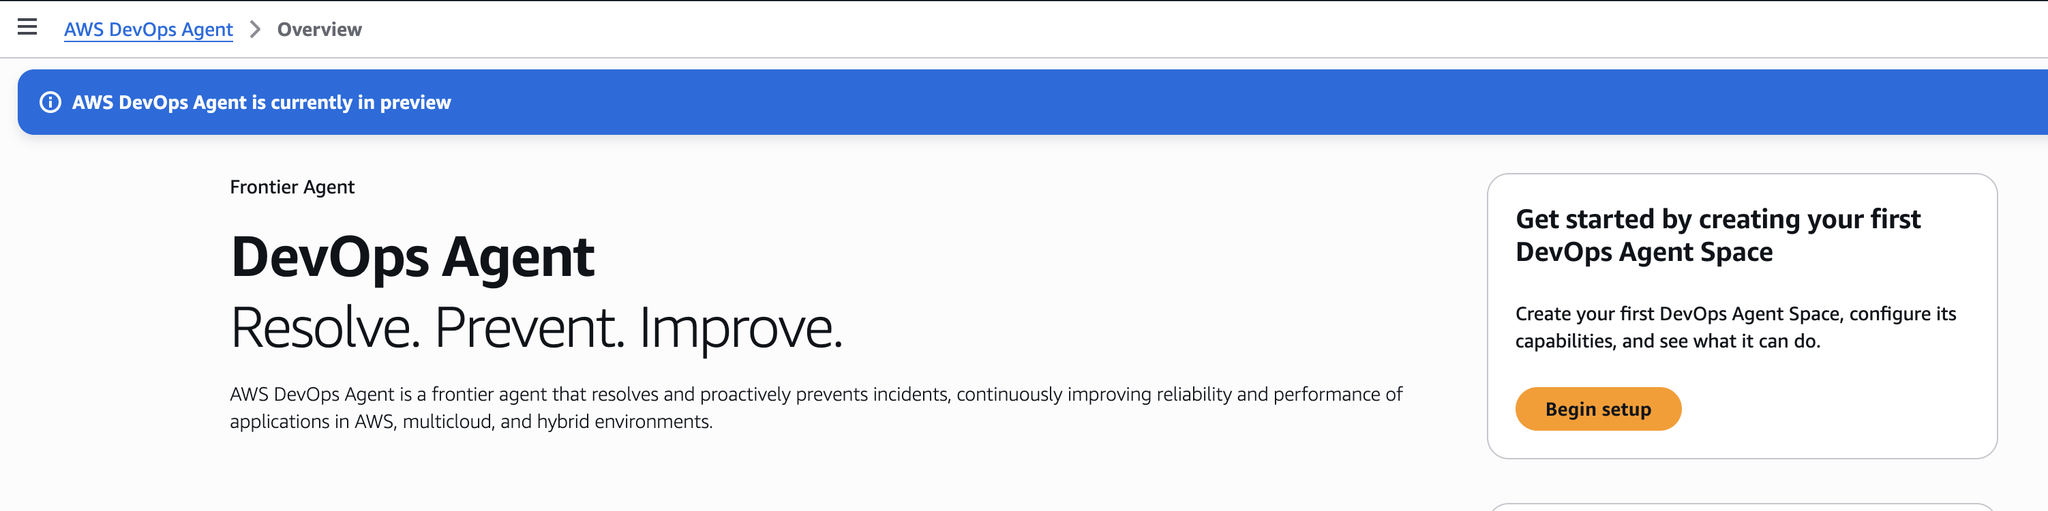
Currently, it is available as a public preview only in the Northern Virginia (us-east-1) region.
In addition to CloudWatch as the source of alert detection and the target of telemetry collection, it is also possible to integrate with the following monitoring services.
- Datadog
- Dynatrace
- New Relic
- Splunk
For more details, please refer to the official AWS blog.
Steps to try using the DevOps Agent
0. Preparation
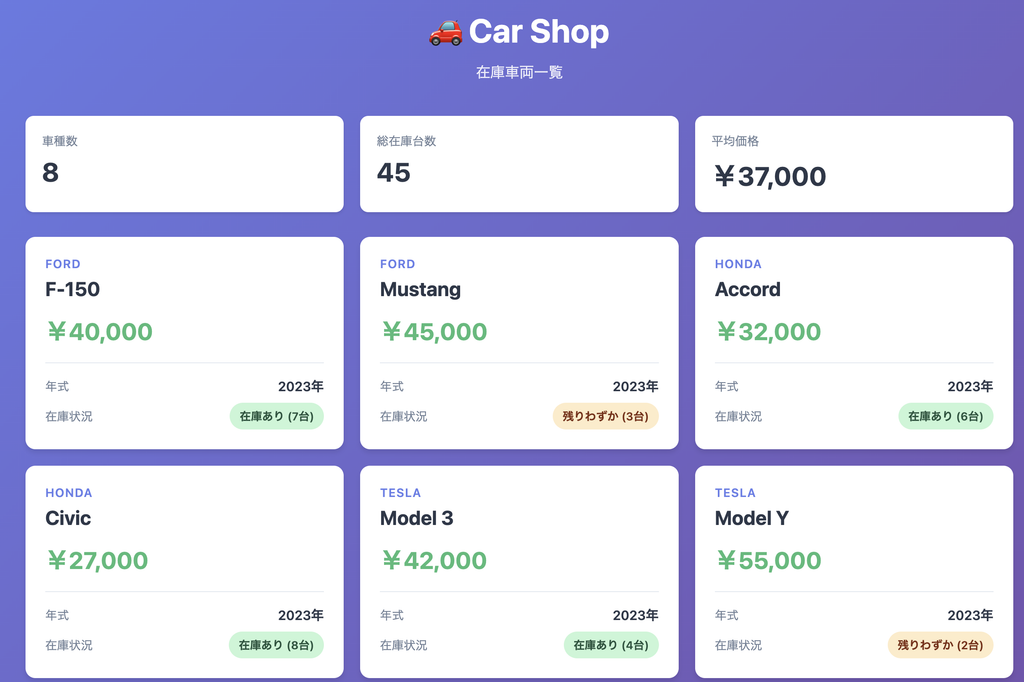
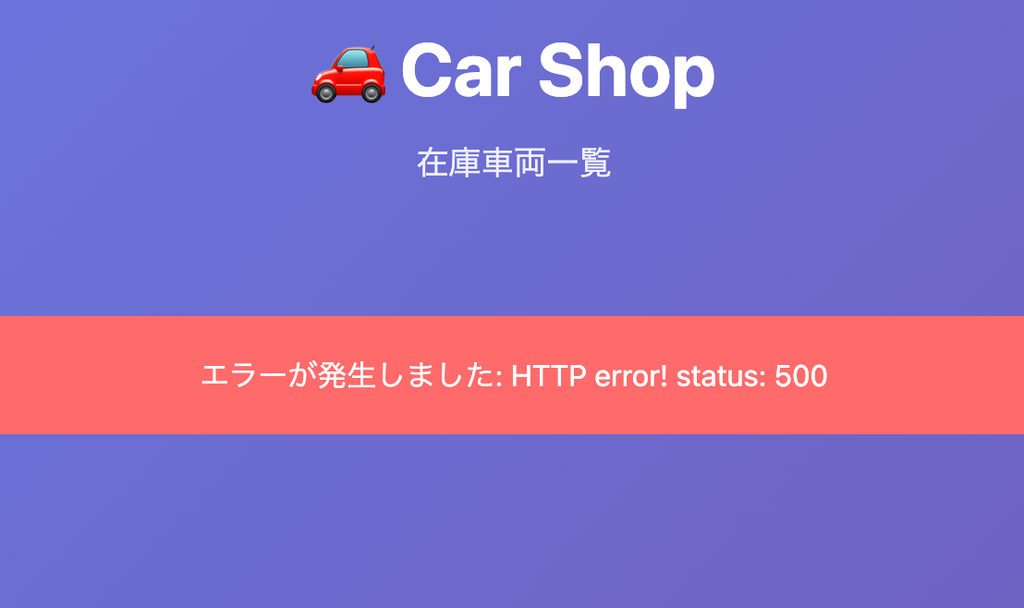
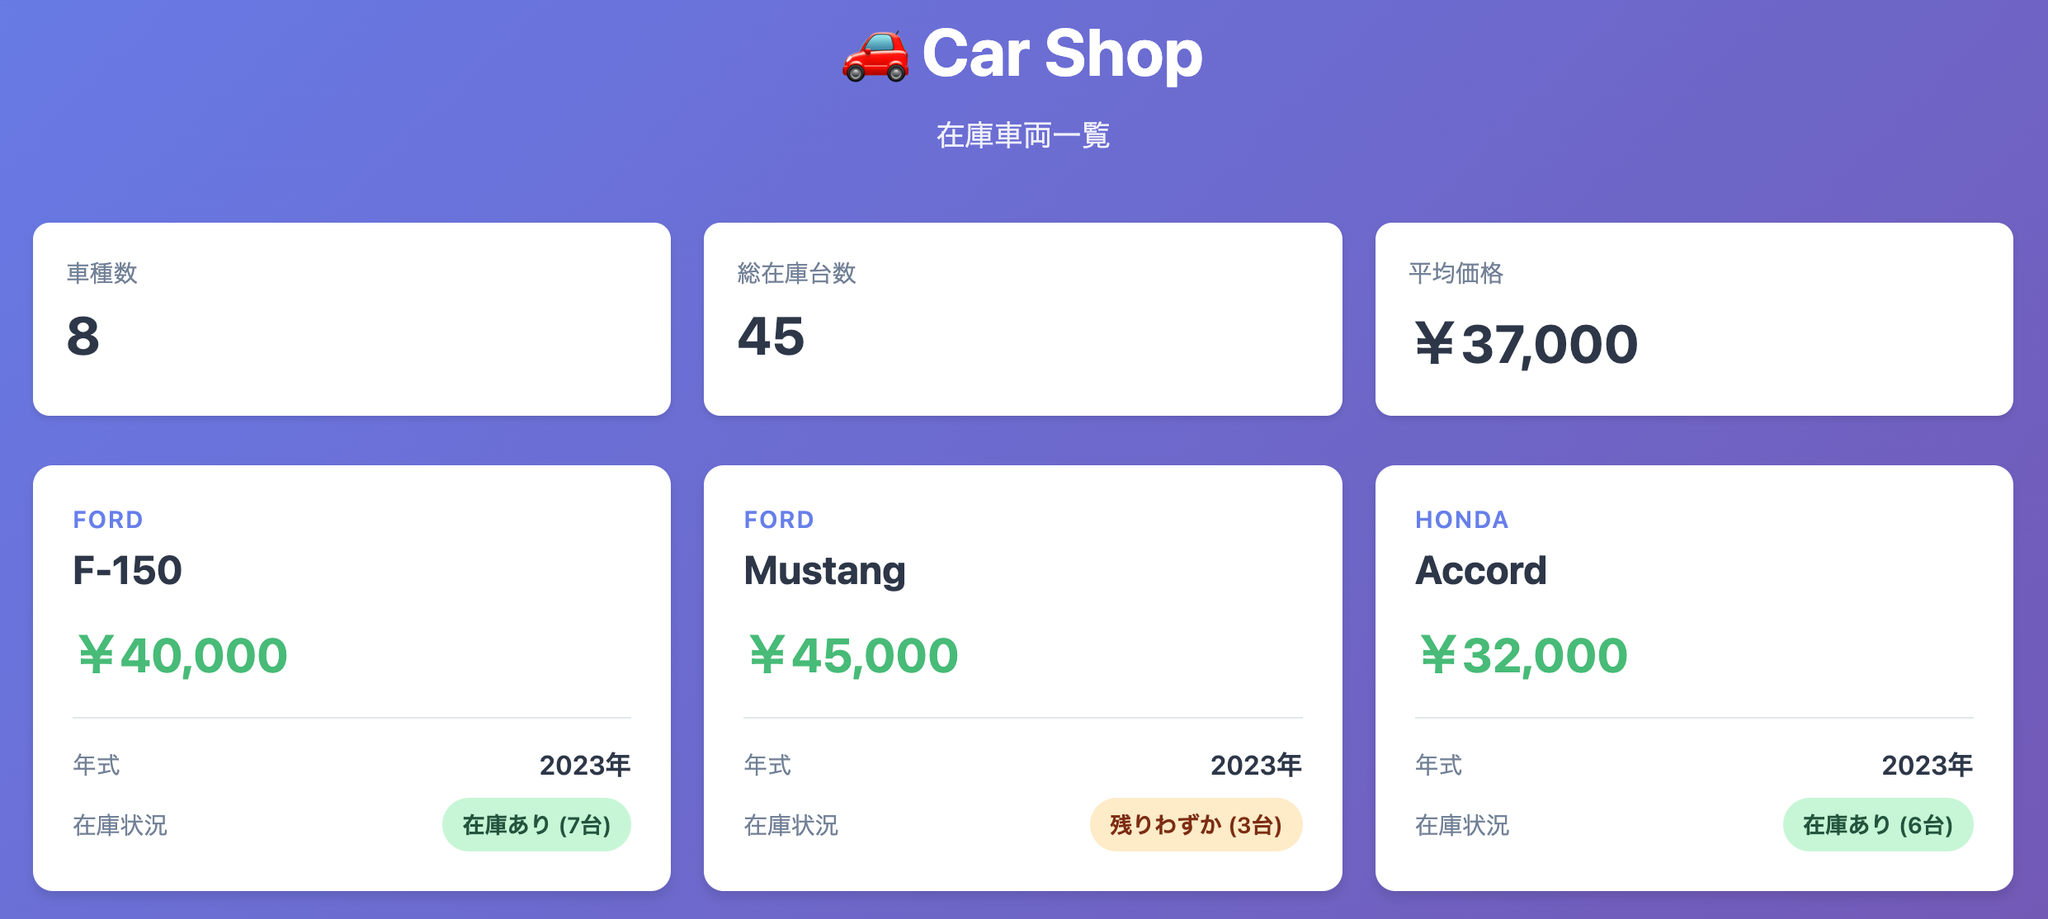
We created a simple web system to make troubleshooting easier to understand.
This is a web system with only the function of displaying a list of cars in stock.
The components are as follows:
- Cloudfront
- S3
- API Gateway
- Lambda
- Aurora MySQL Serverless v2
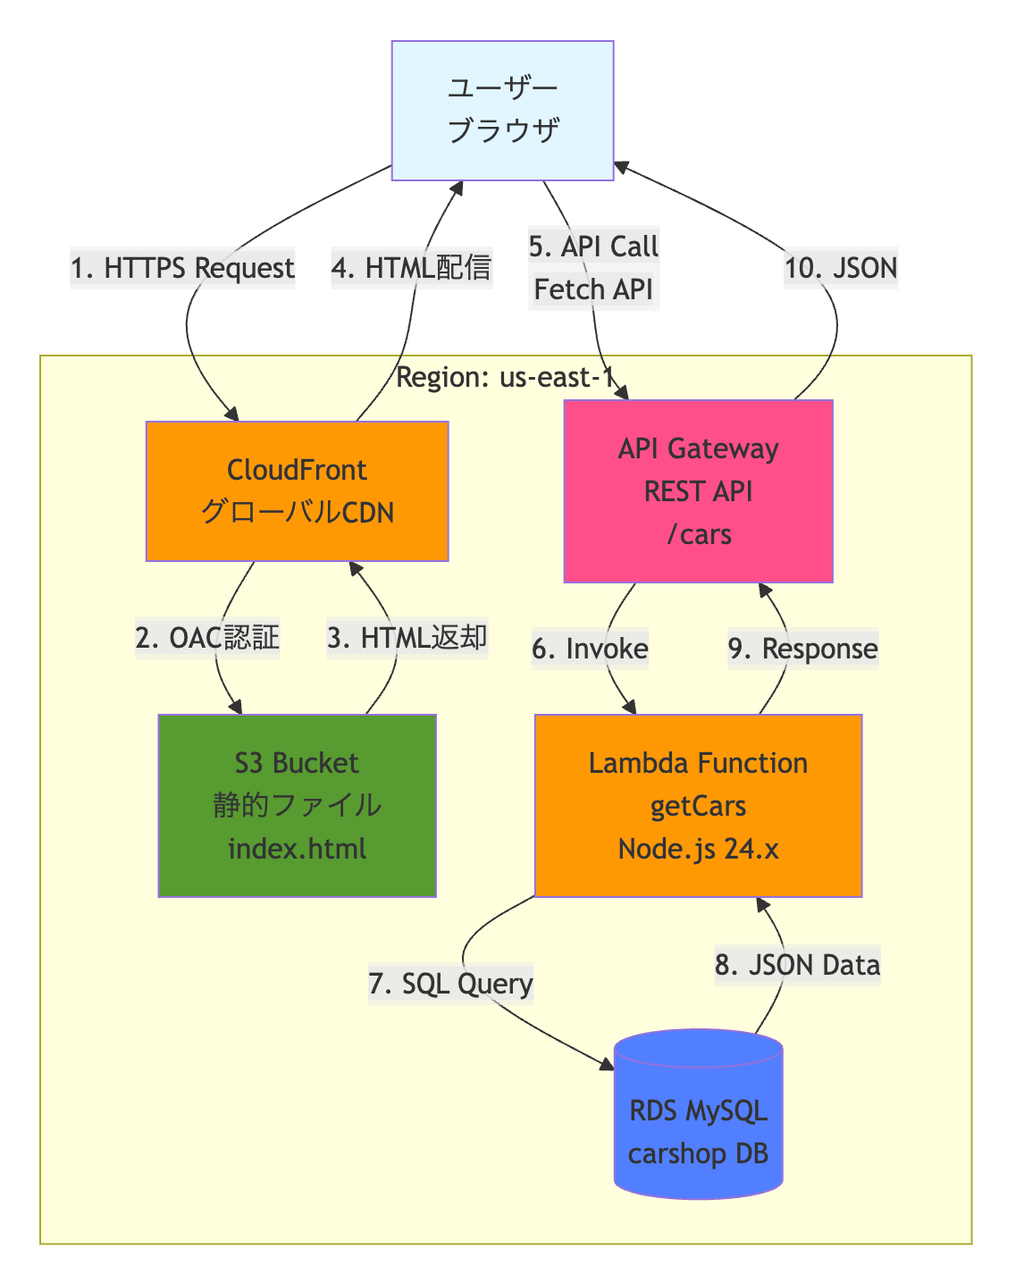
Every time a user accesses the web system, Lambda executes a SELECT query to Aurora MySQL.
Although not mentioned in the components, I've set up CloudWatch alarms to detect errors in the Lambda and API Gateway access logs.
1. Create a DevOps Agent Space
Set the region to us-east-1, open the DevOps Agent, and click Begin Setup.
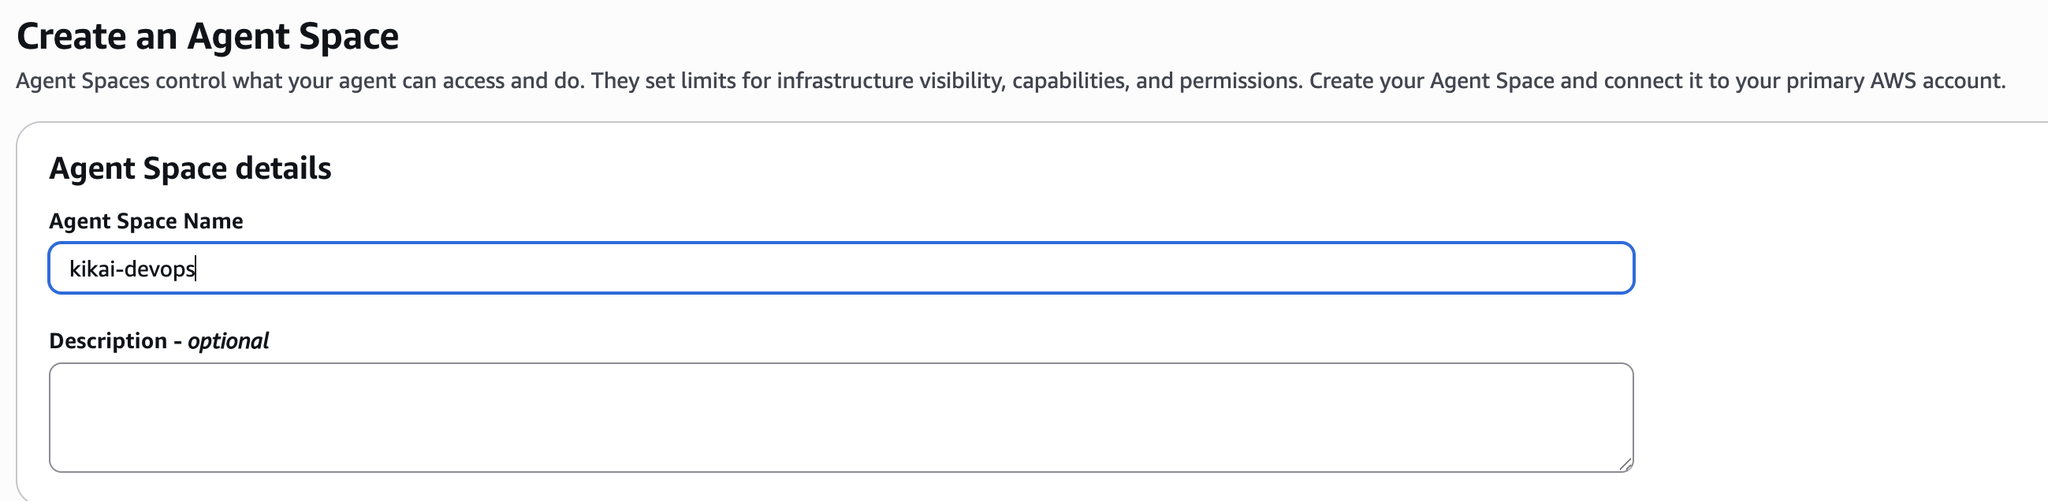
Enter a suitable Agent Space name and create it.
You can leave the other inputs at their default values for now.
Once created, you will see a screen like the one below, so click "Operator Access".
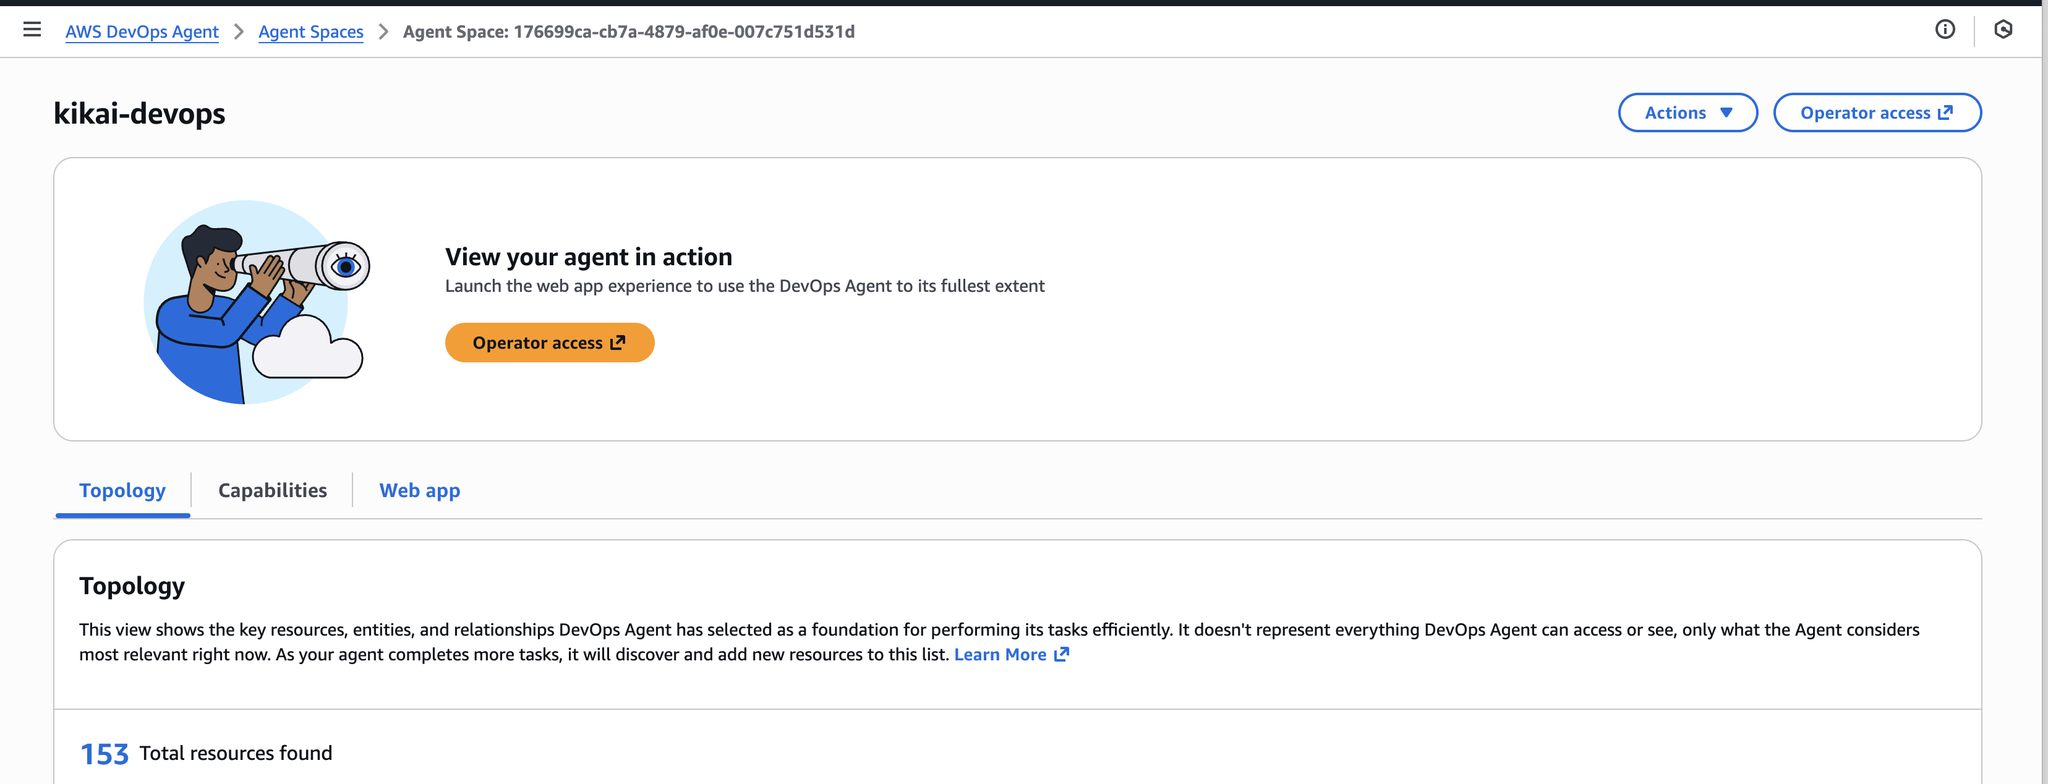
That's all it takes to complete the basic setup.
Next, let's open the DevOps Center tab.
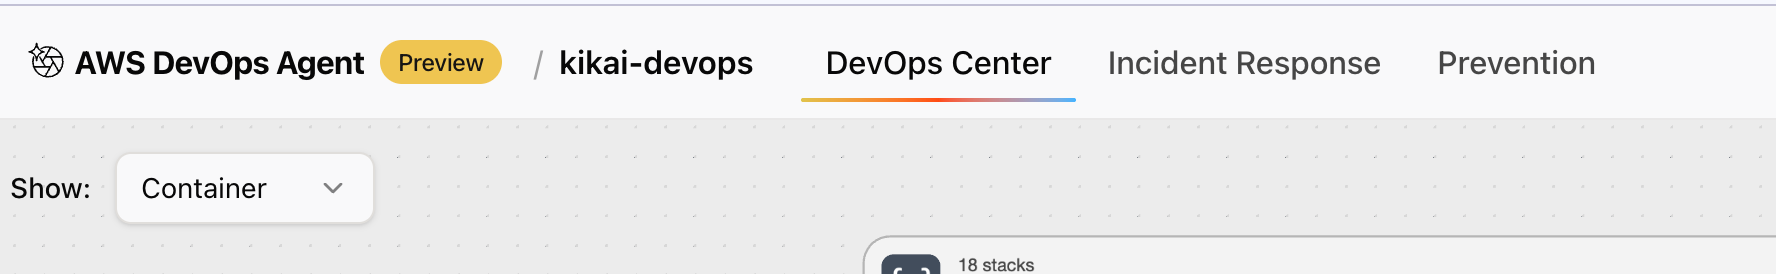
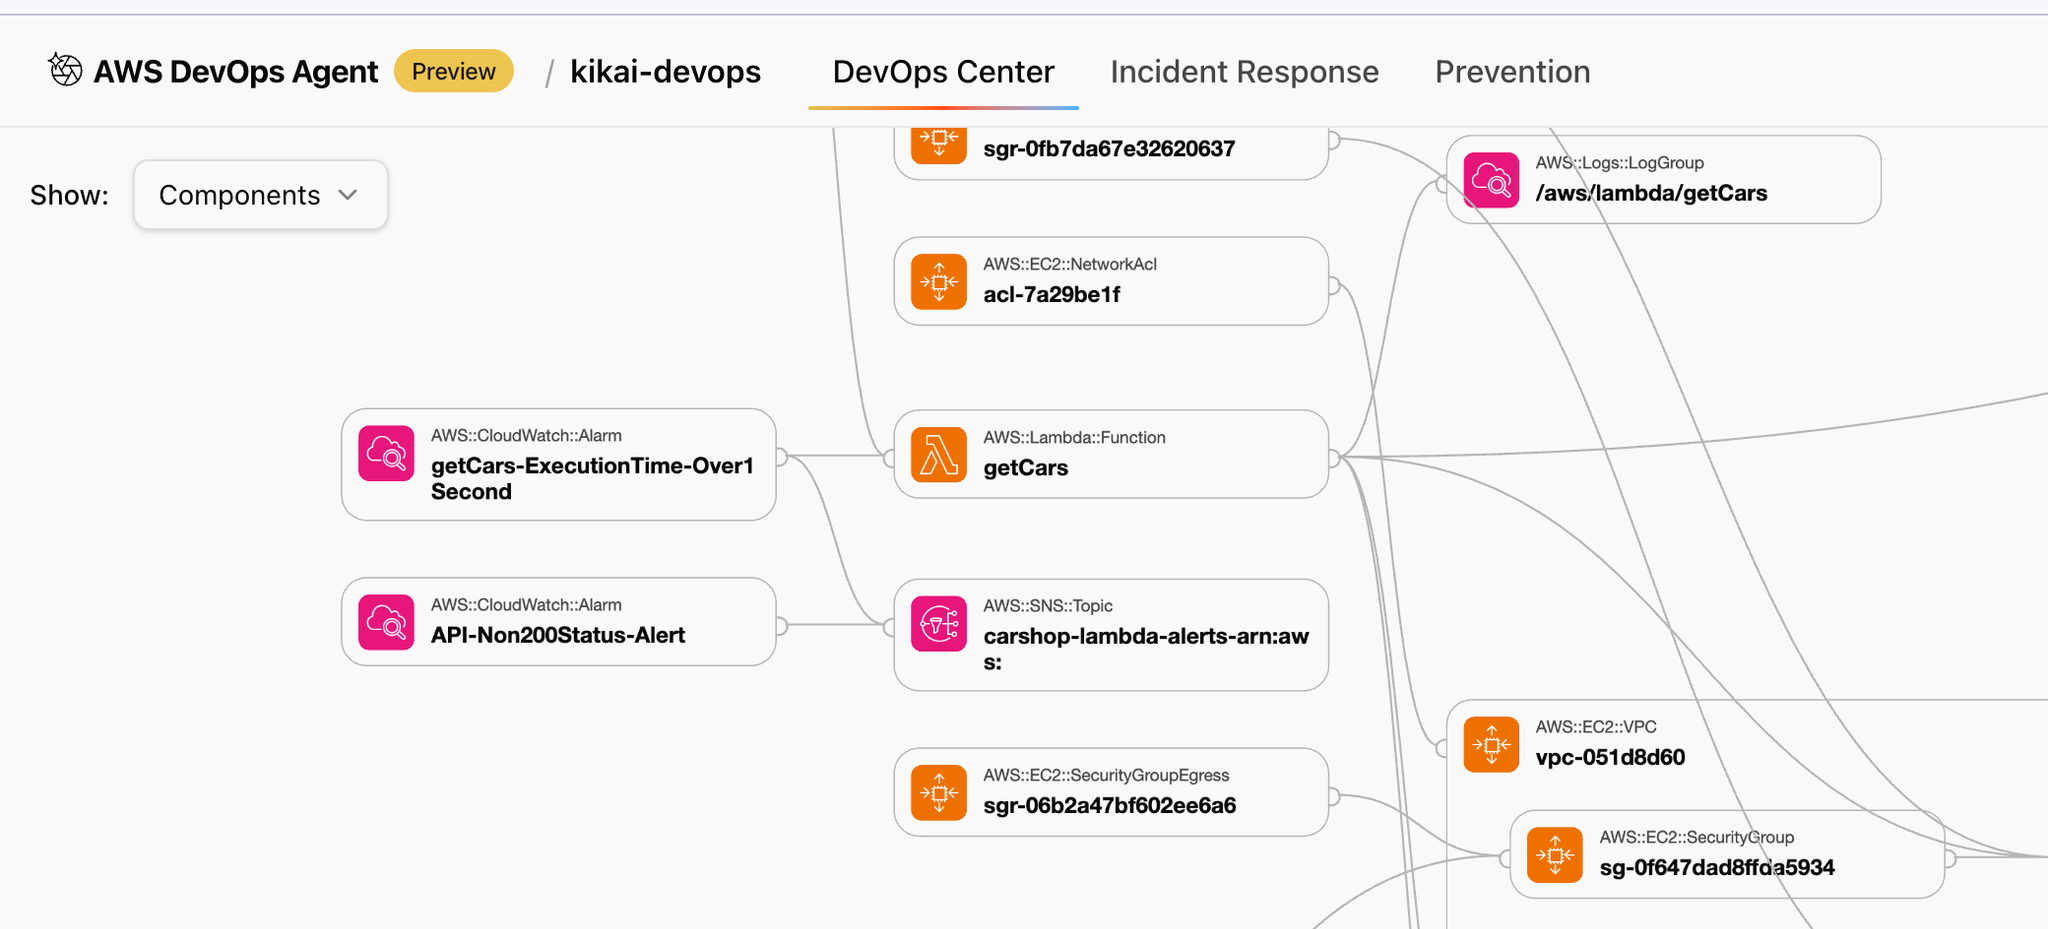
Switching to Show Components will allow you to see the components running within that AWS account.
2. Instruct the DevOps Agent to conduct an investigation.
First, let's intentionally create a malfunction.
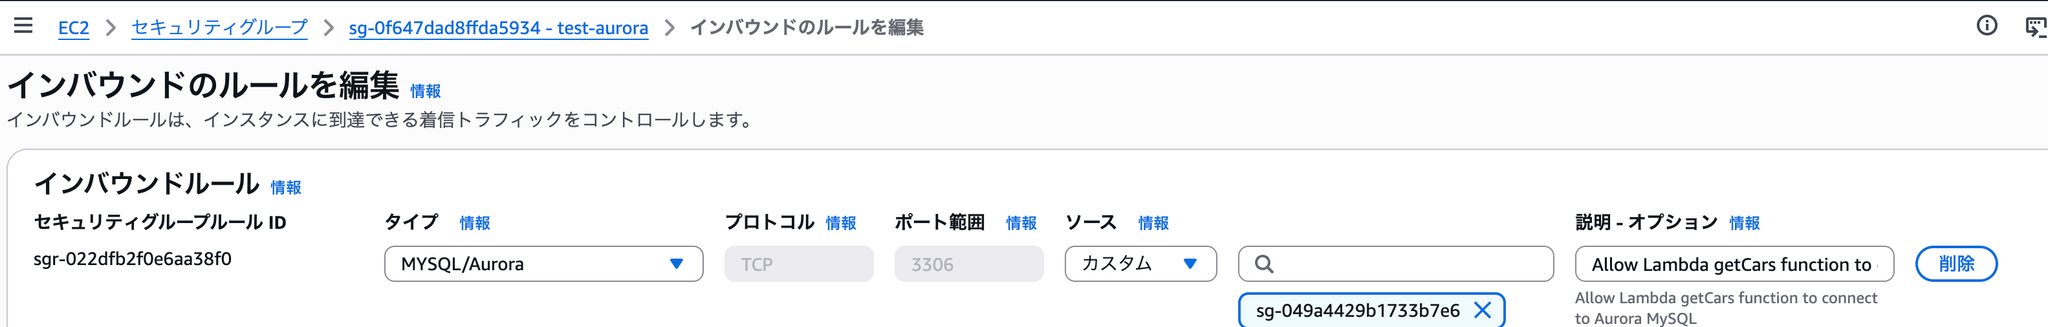
Let's try removing the part of the security group used by Aurora MySQL that allows access from Lambda.
This resulted in an error in the web system because Lambda could not access Aurora MySQL.
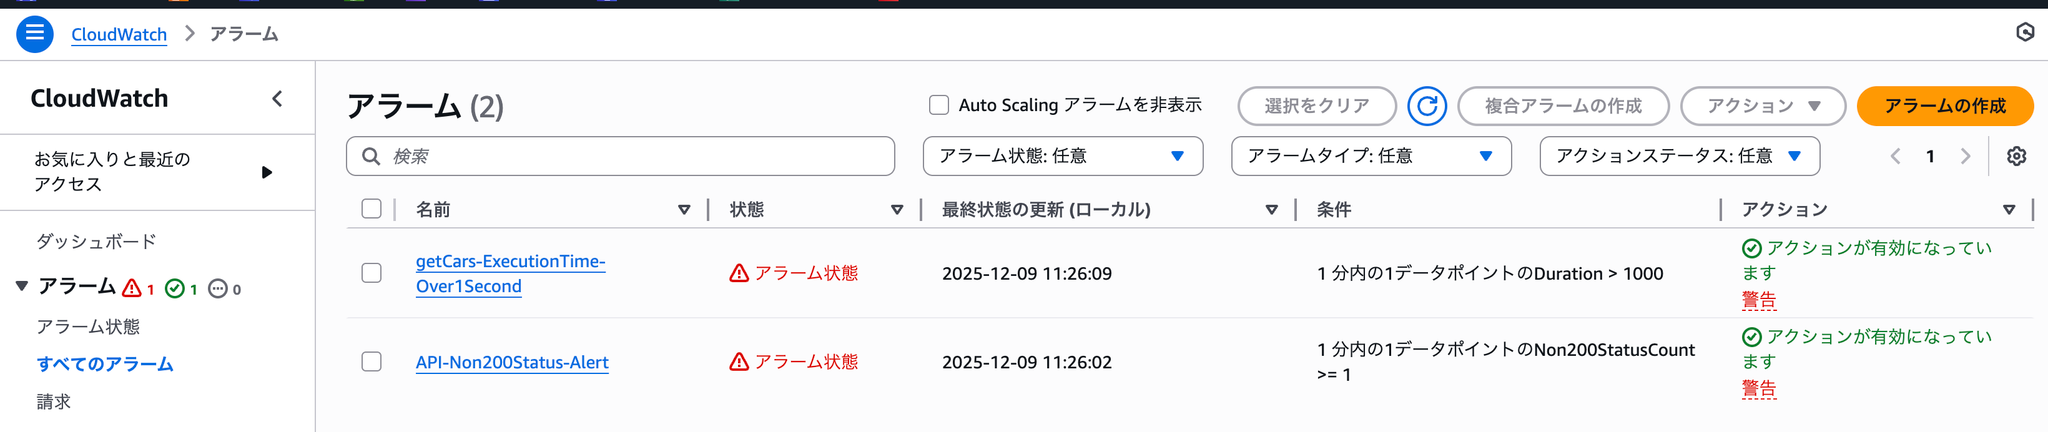
If you check the CloudWatch alarms that you set up in advance, you can see that alarms for Lambda and API Gateway are going off.
Now, let's ask the DevOps Agent to investigate the issue.
You can initiate an investigation into the problem using the Incident Response tab in the DevOps Agent. (English only)
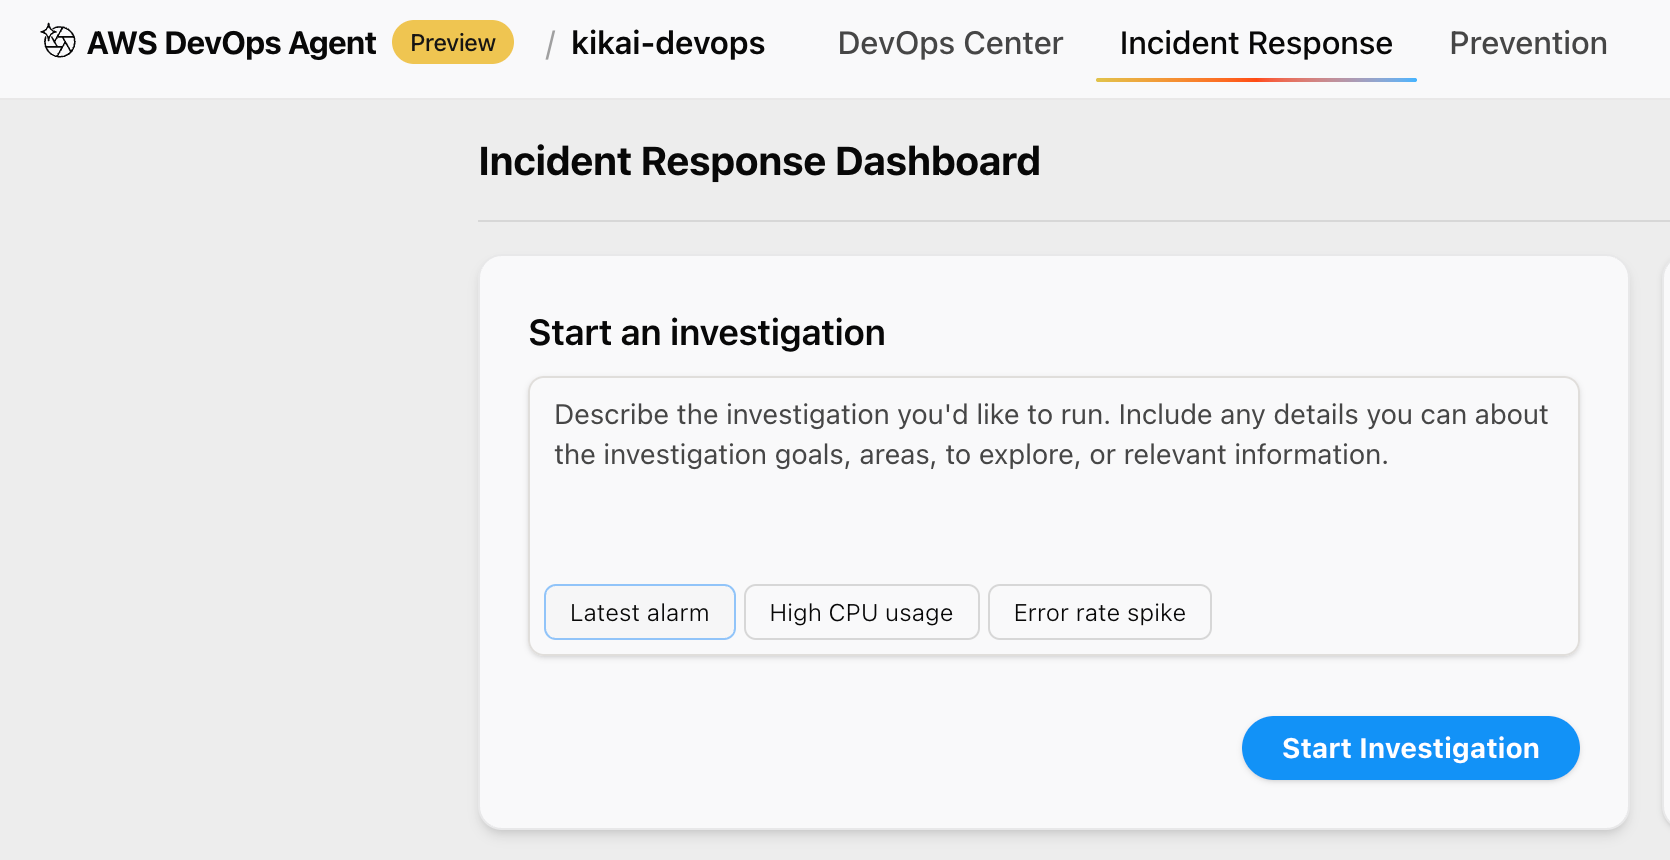
Even without entering any information, clicking the [Latest alarm] button displayed will generate a nice-looking instruction.
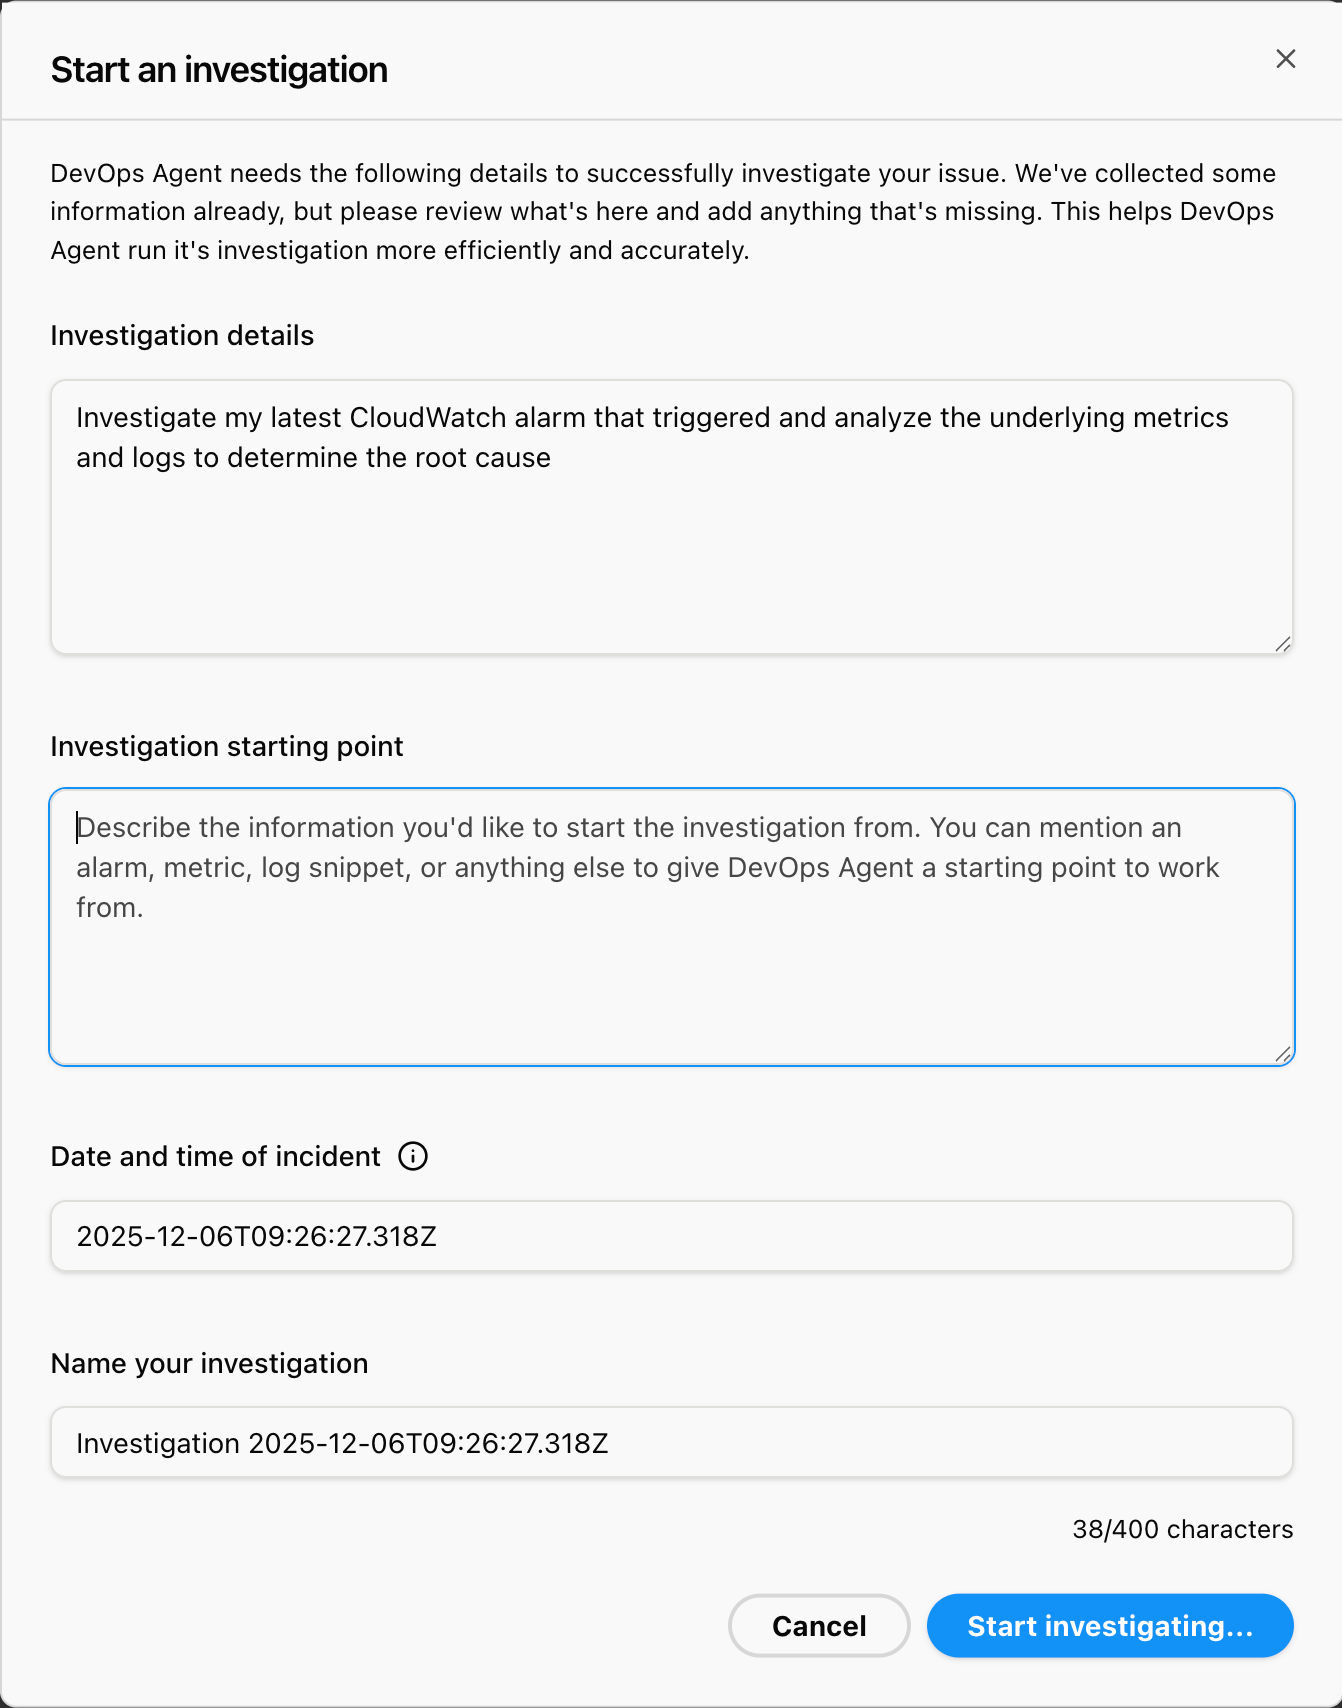
Investigation details:
Once you have entered all the information, click Start Adjusting.
Then, you can see the investigation progressing rapidly in real time.
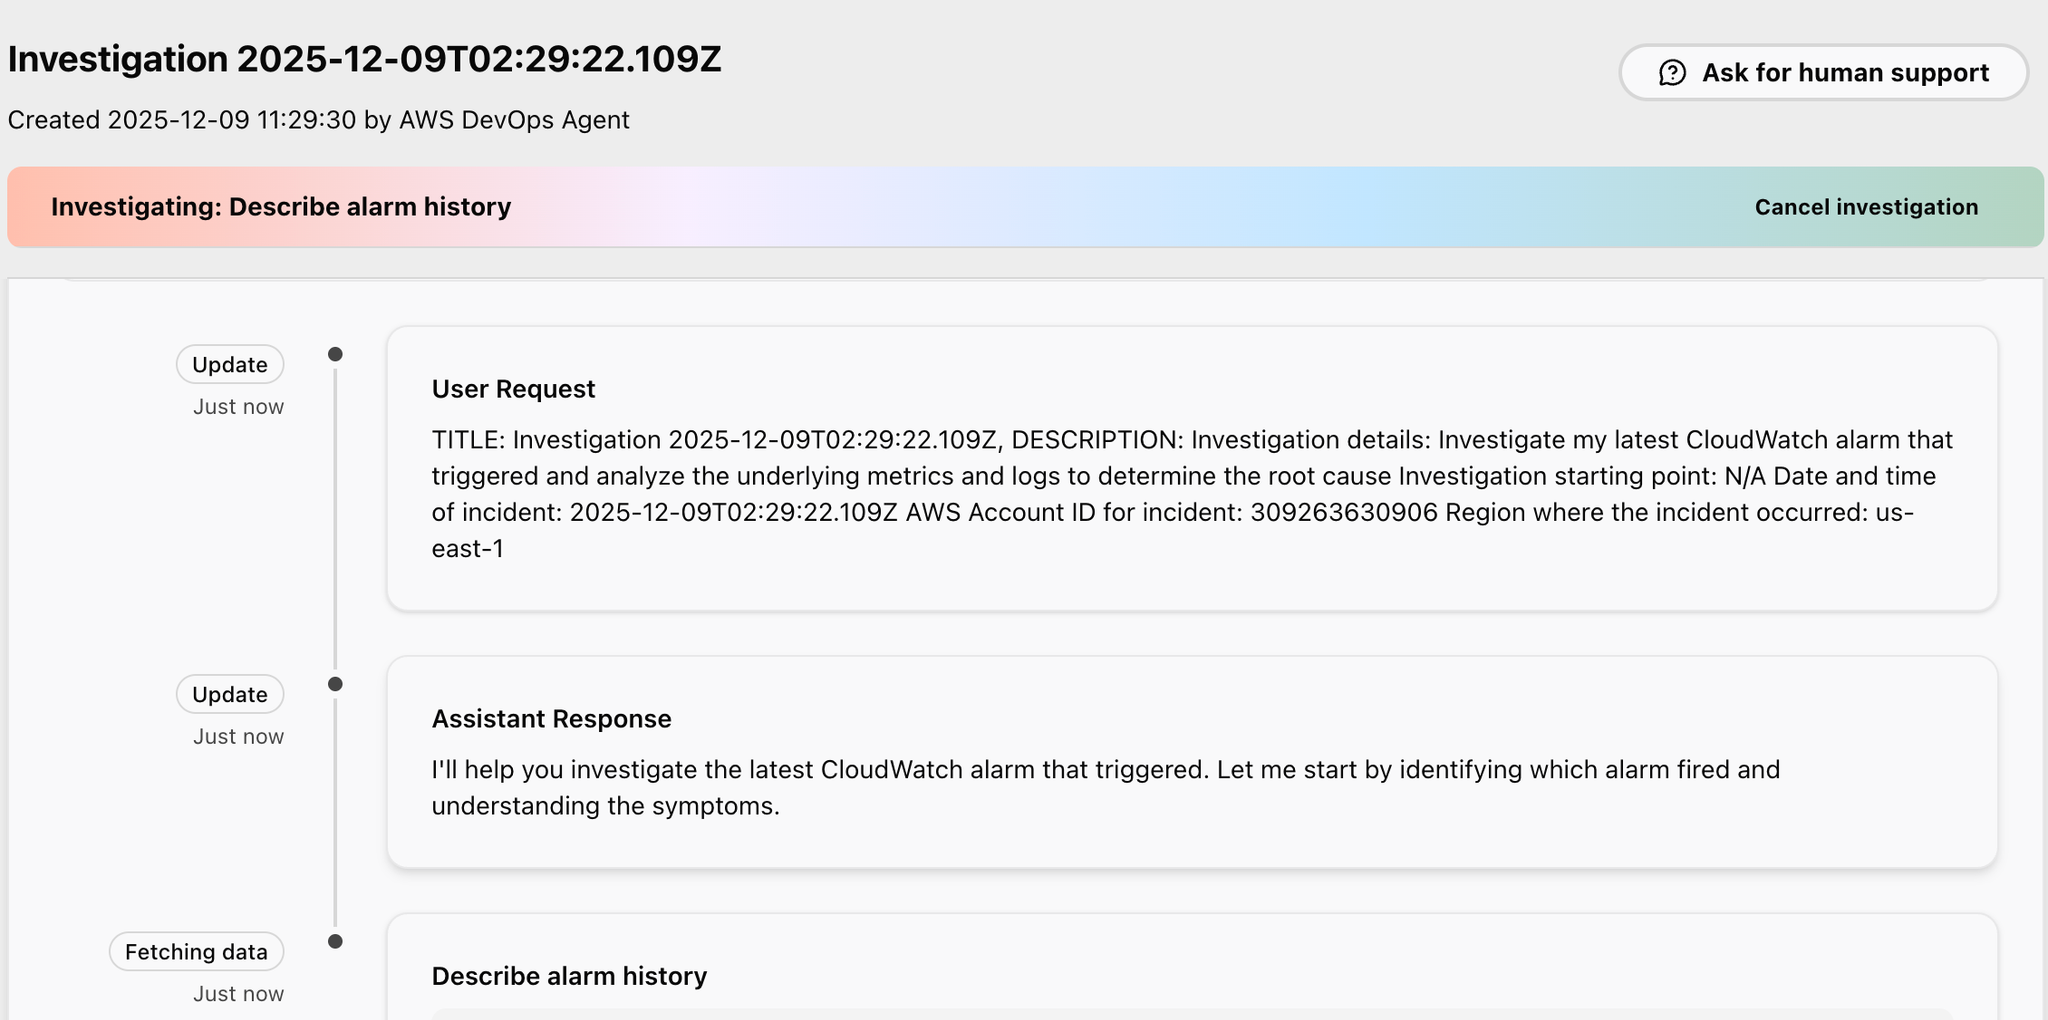
Please wait a few minutes for this to complete.
A few minutes later, they seemed to have found the cause.
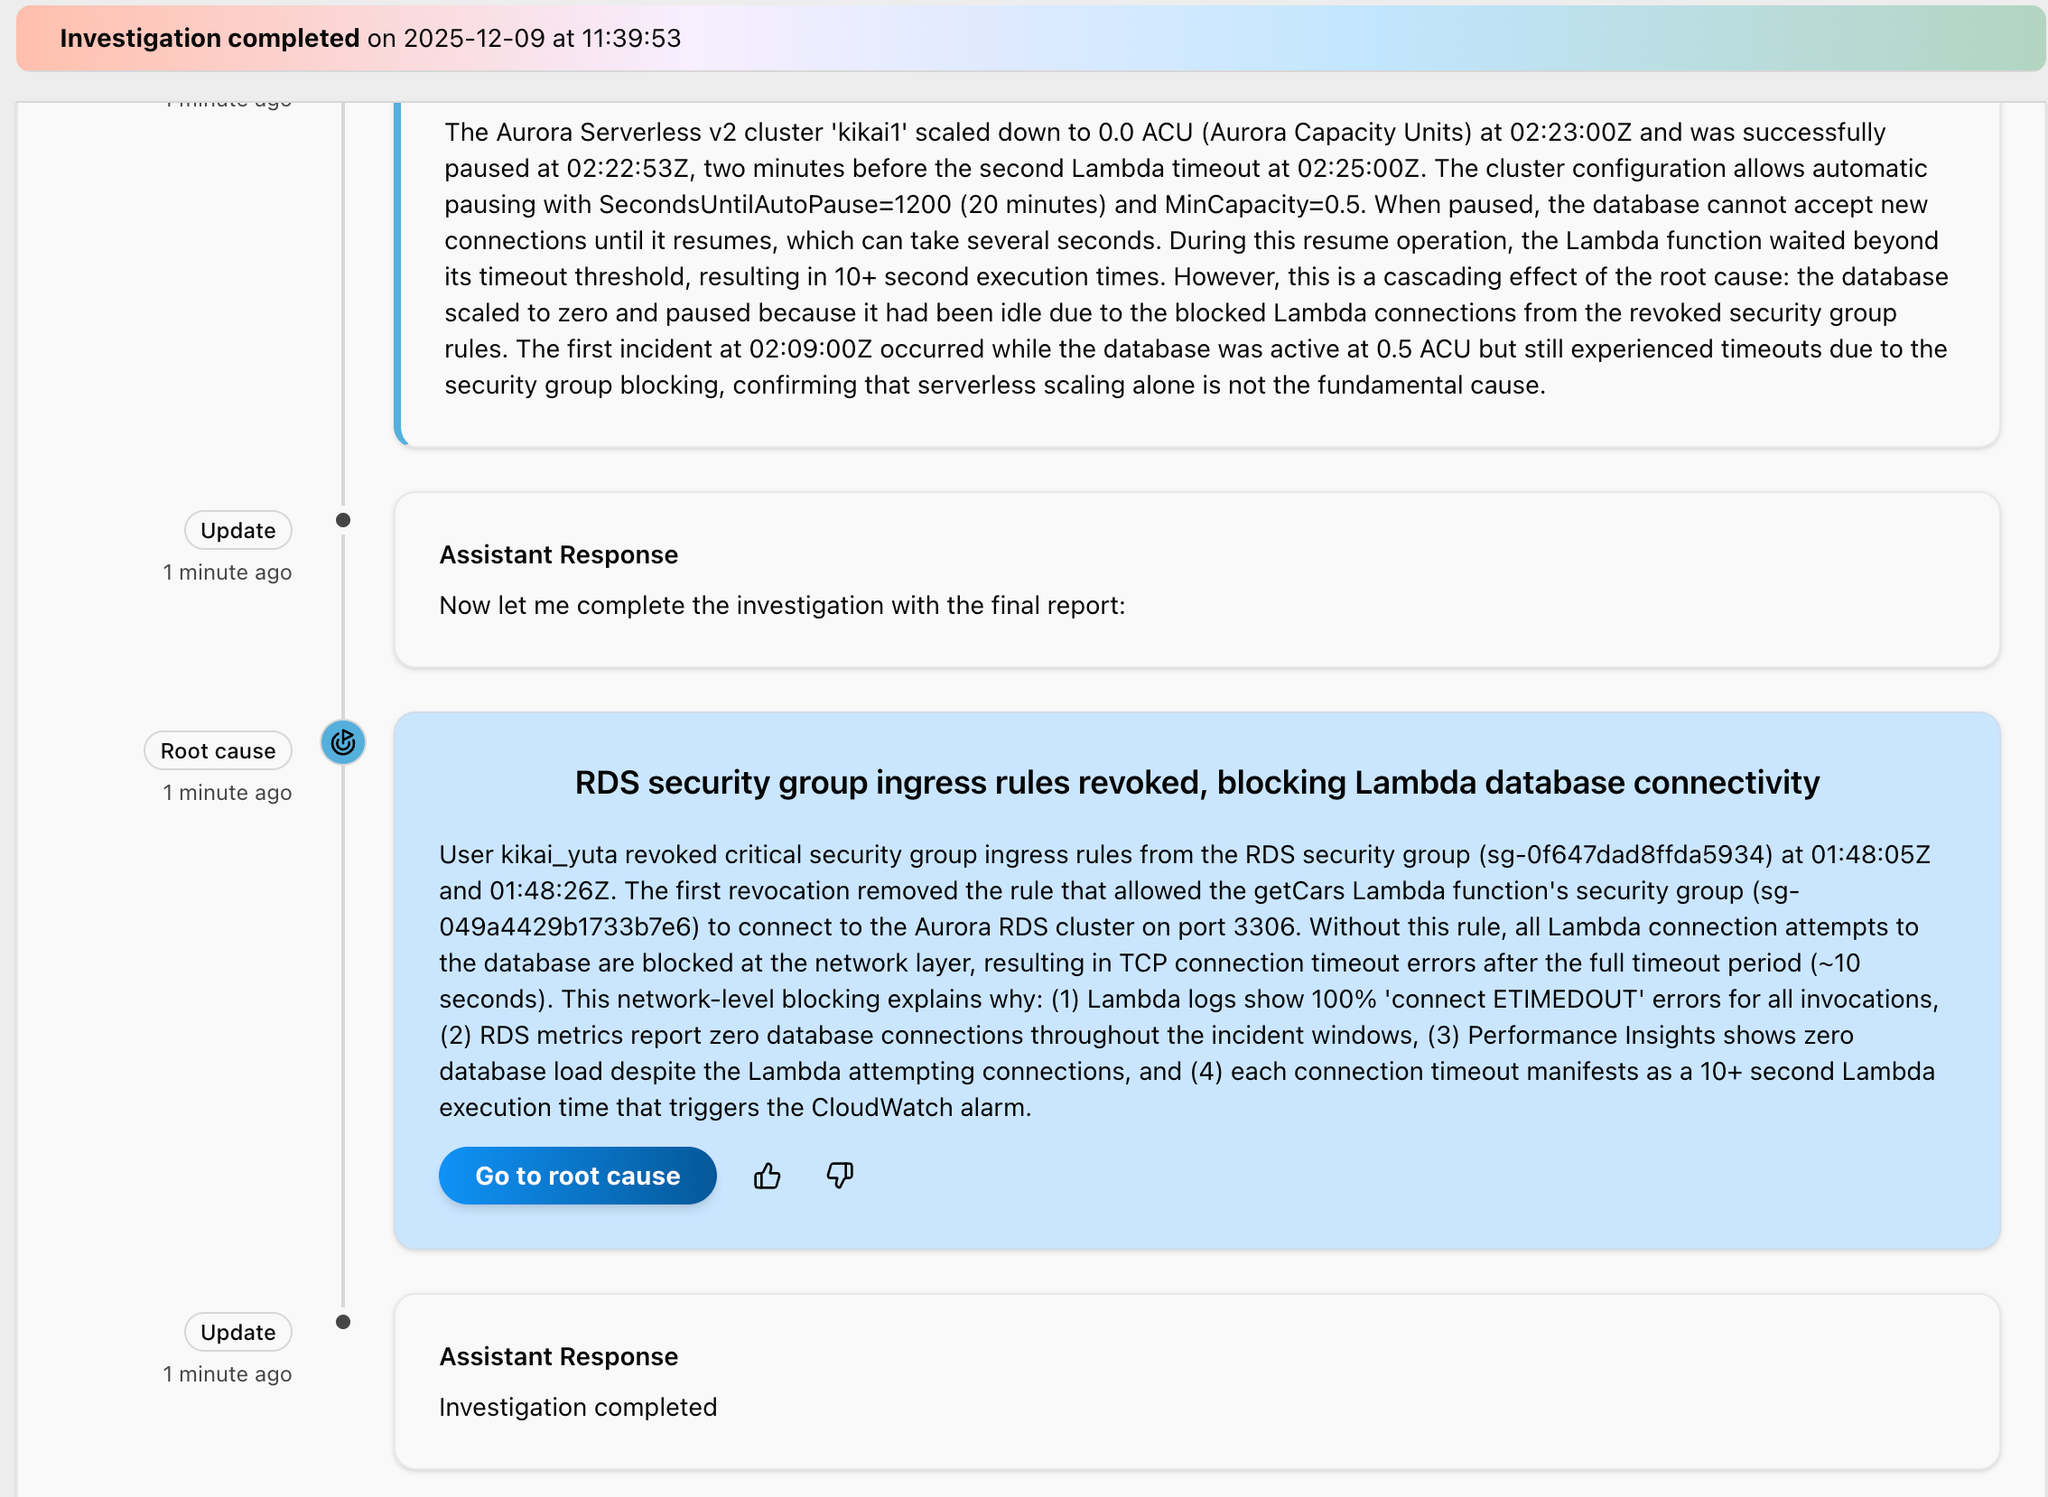
Userkikai_yuta teeth,01:48:05Z and 01:48:26ZRDS security group (sg-0f647dad8ffda5934We removed the inbound rules for important security groups from ).
In the initial deletion,getCars Lambda functionsecurity group (sg-049a4429b1733b7e6)but Aurora RDS cluster port 3306The rule that allowed connection to [the specified location] has been removed.
Without this rule, all connection attempts from Lambda to the database will be blocked at the network layer, resulting inTCP connection timeout error after a timeout period of approximately 10 seconds.This will occur.
This network-level blocking can explain the following phenomena:
- Lambda logs show a "connect ETIMEDOUT" error 100% of the time for every invocation.
- Throughout the incident period, the RDS metrics reported a database connection count of 0.
- Performance Insights shows a database load of 0 despite Lambda attempting to connect.
- Each connection timeout occurs when the Lambda execution time exceeds 10 seconds, triggering a CloudWatch alarm.
Click the "Go to root cause" button that is displayed.
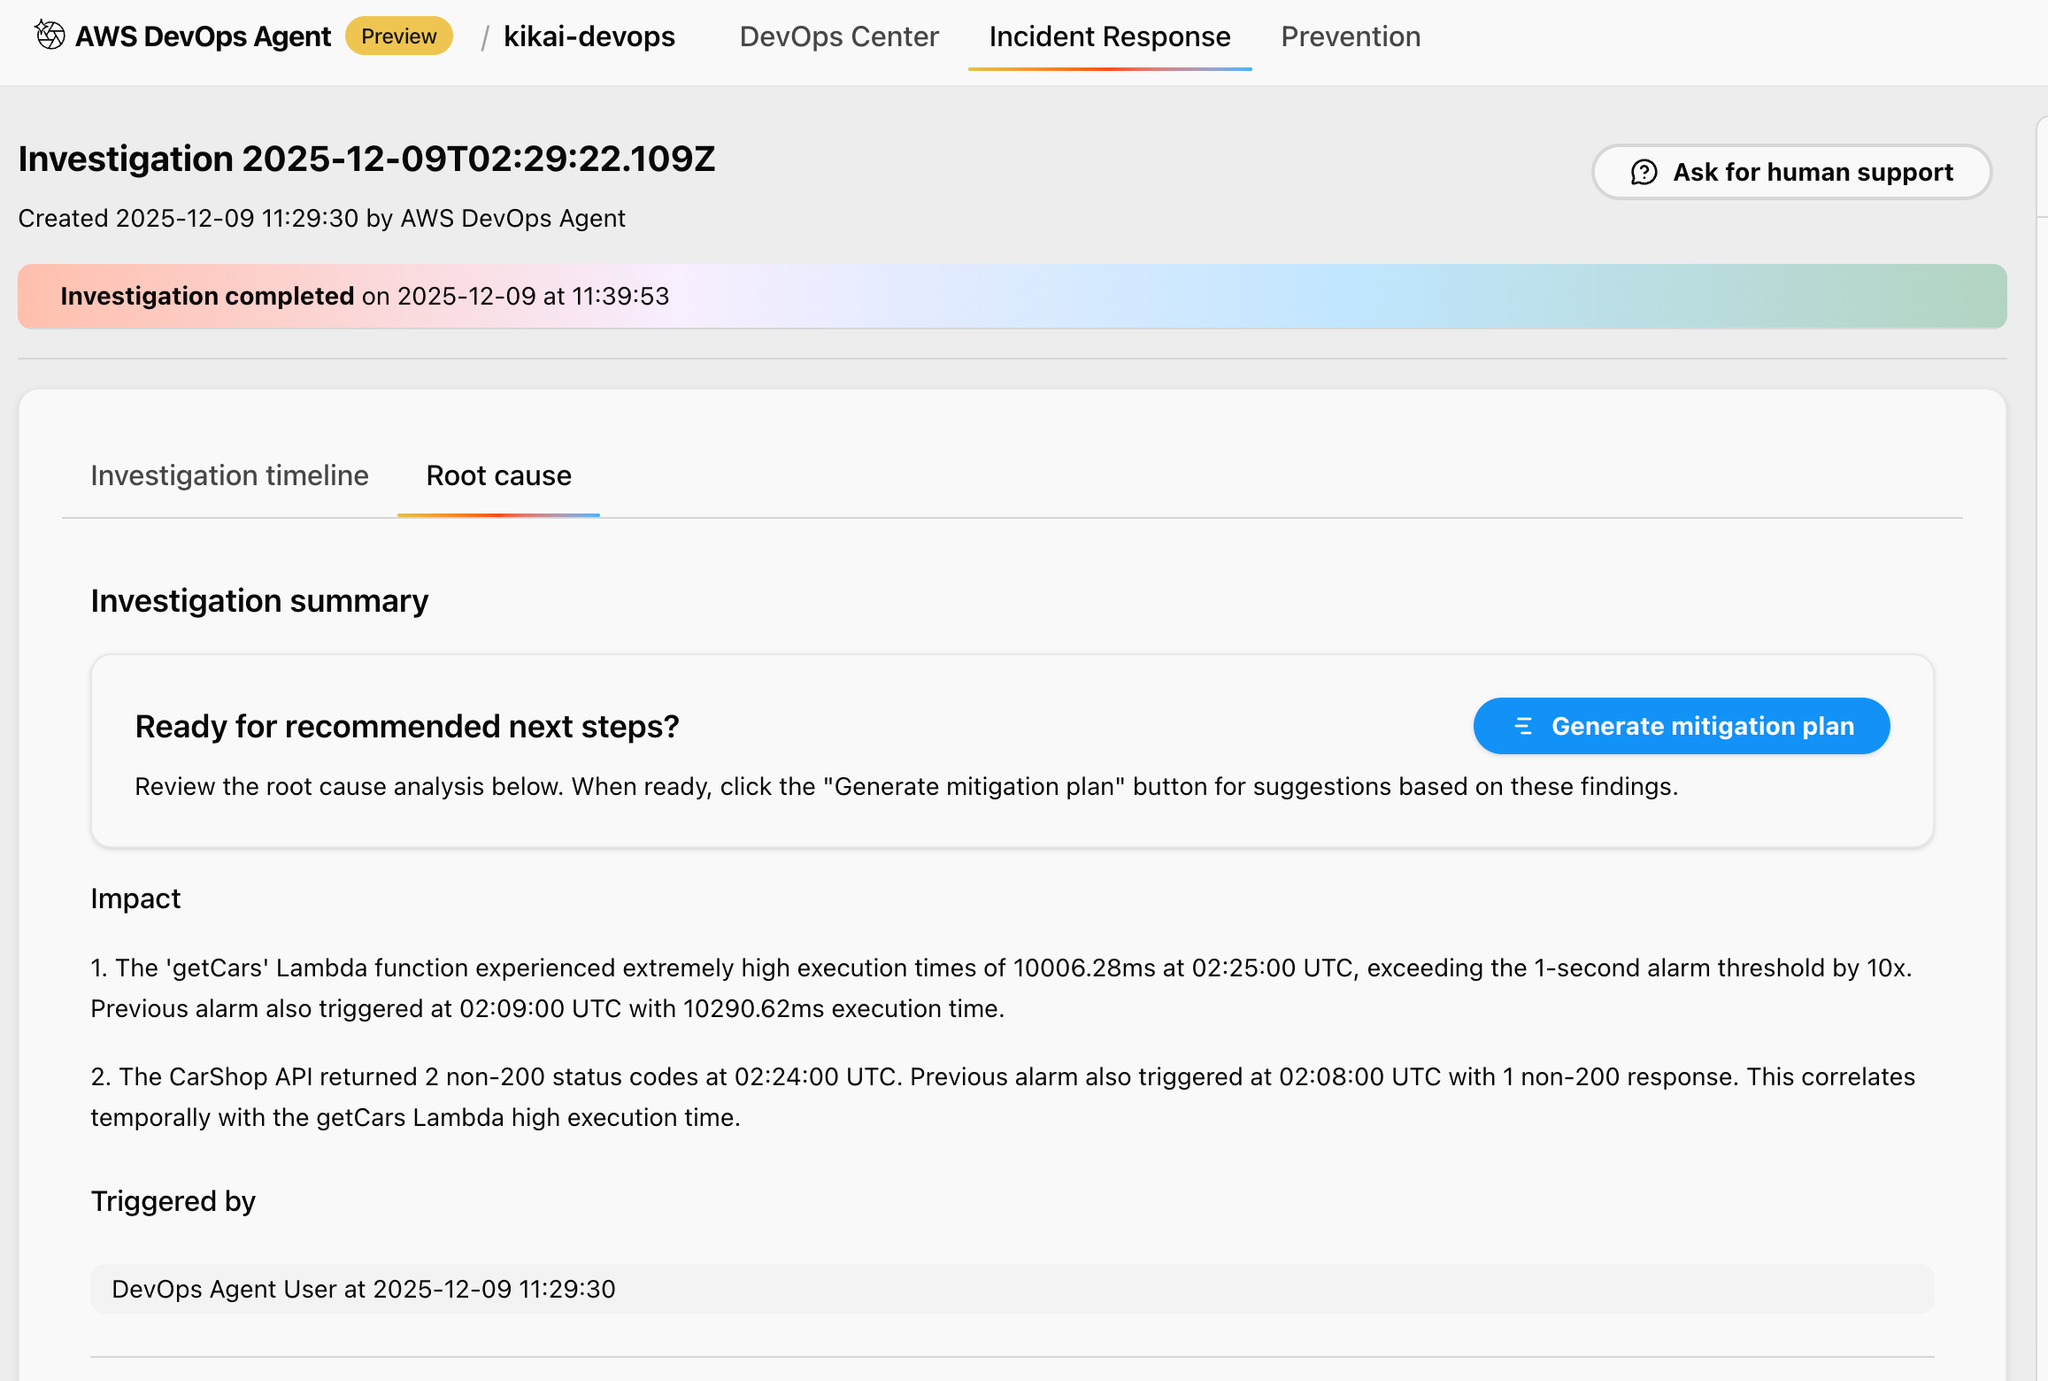
Then, the following screen will appear, so click "Generate mitigation plan".
(A mitigation plan involves creating mitigation measures.)
Let's wait a few minutes for this to complete.
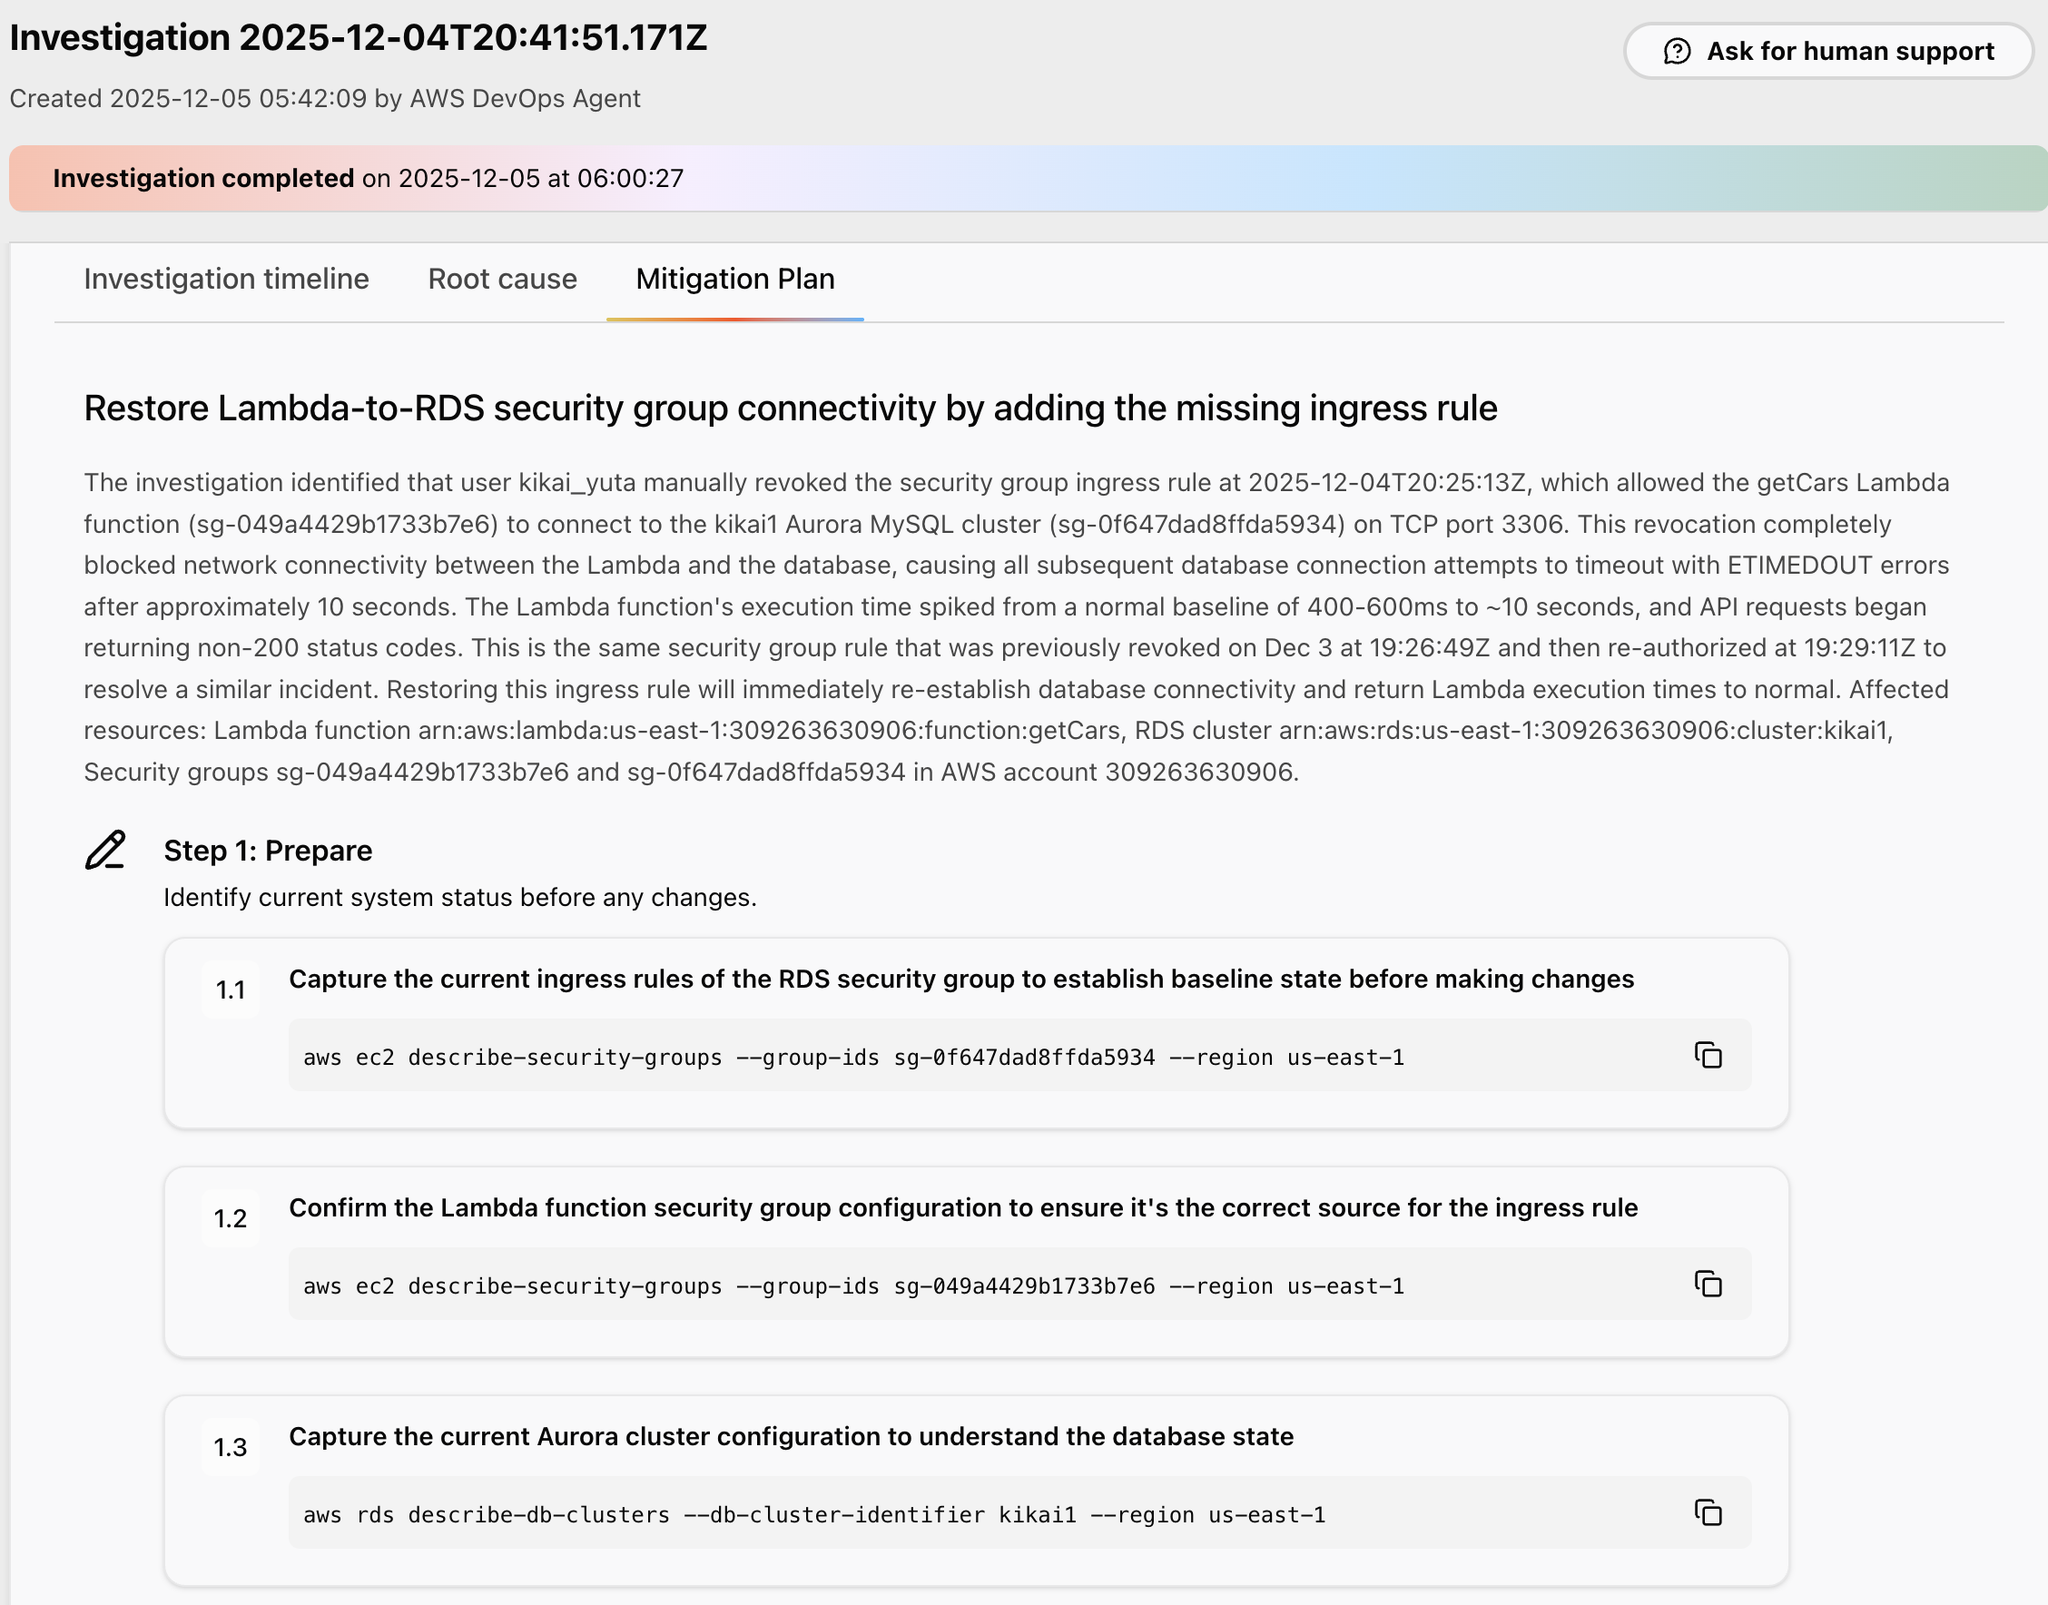
Once the mitigation plan is complete, proposals will be made step by step as follows:
Step 1 is preparation, and it suggests AWS CLI commands to check the current status.
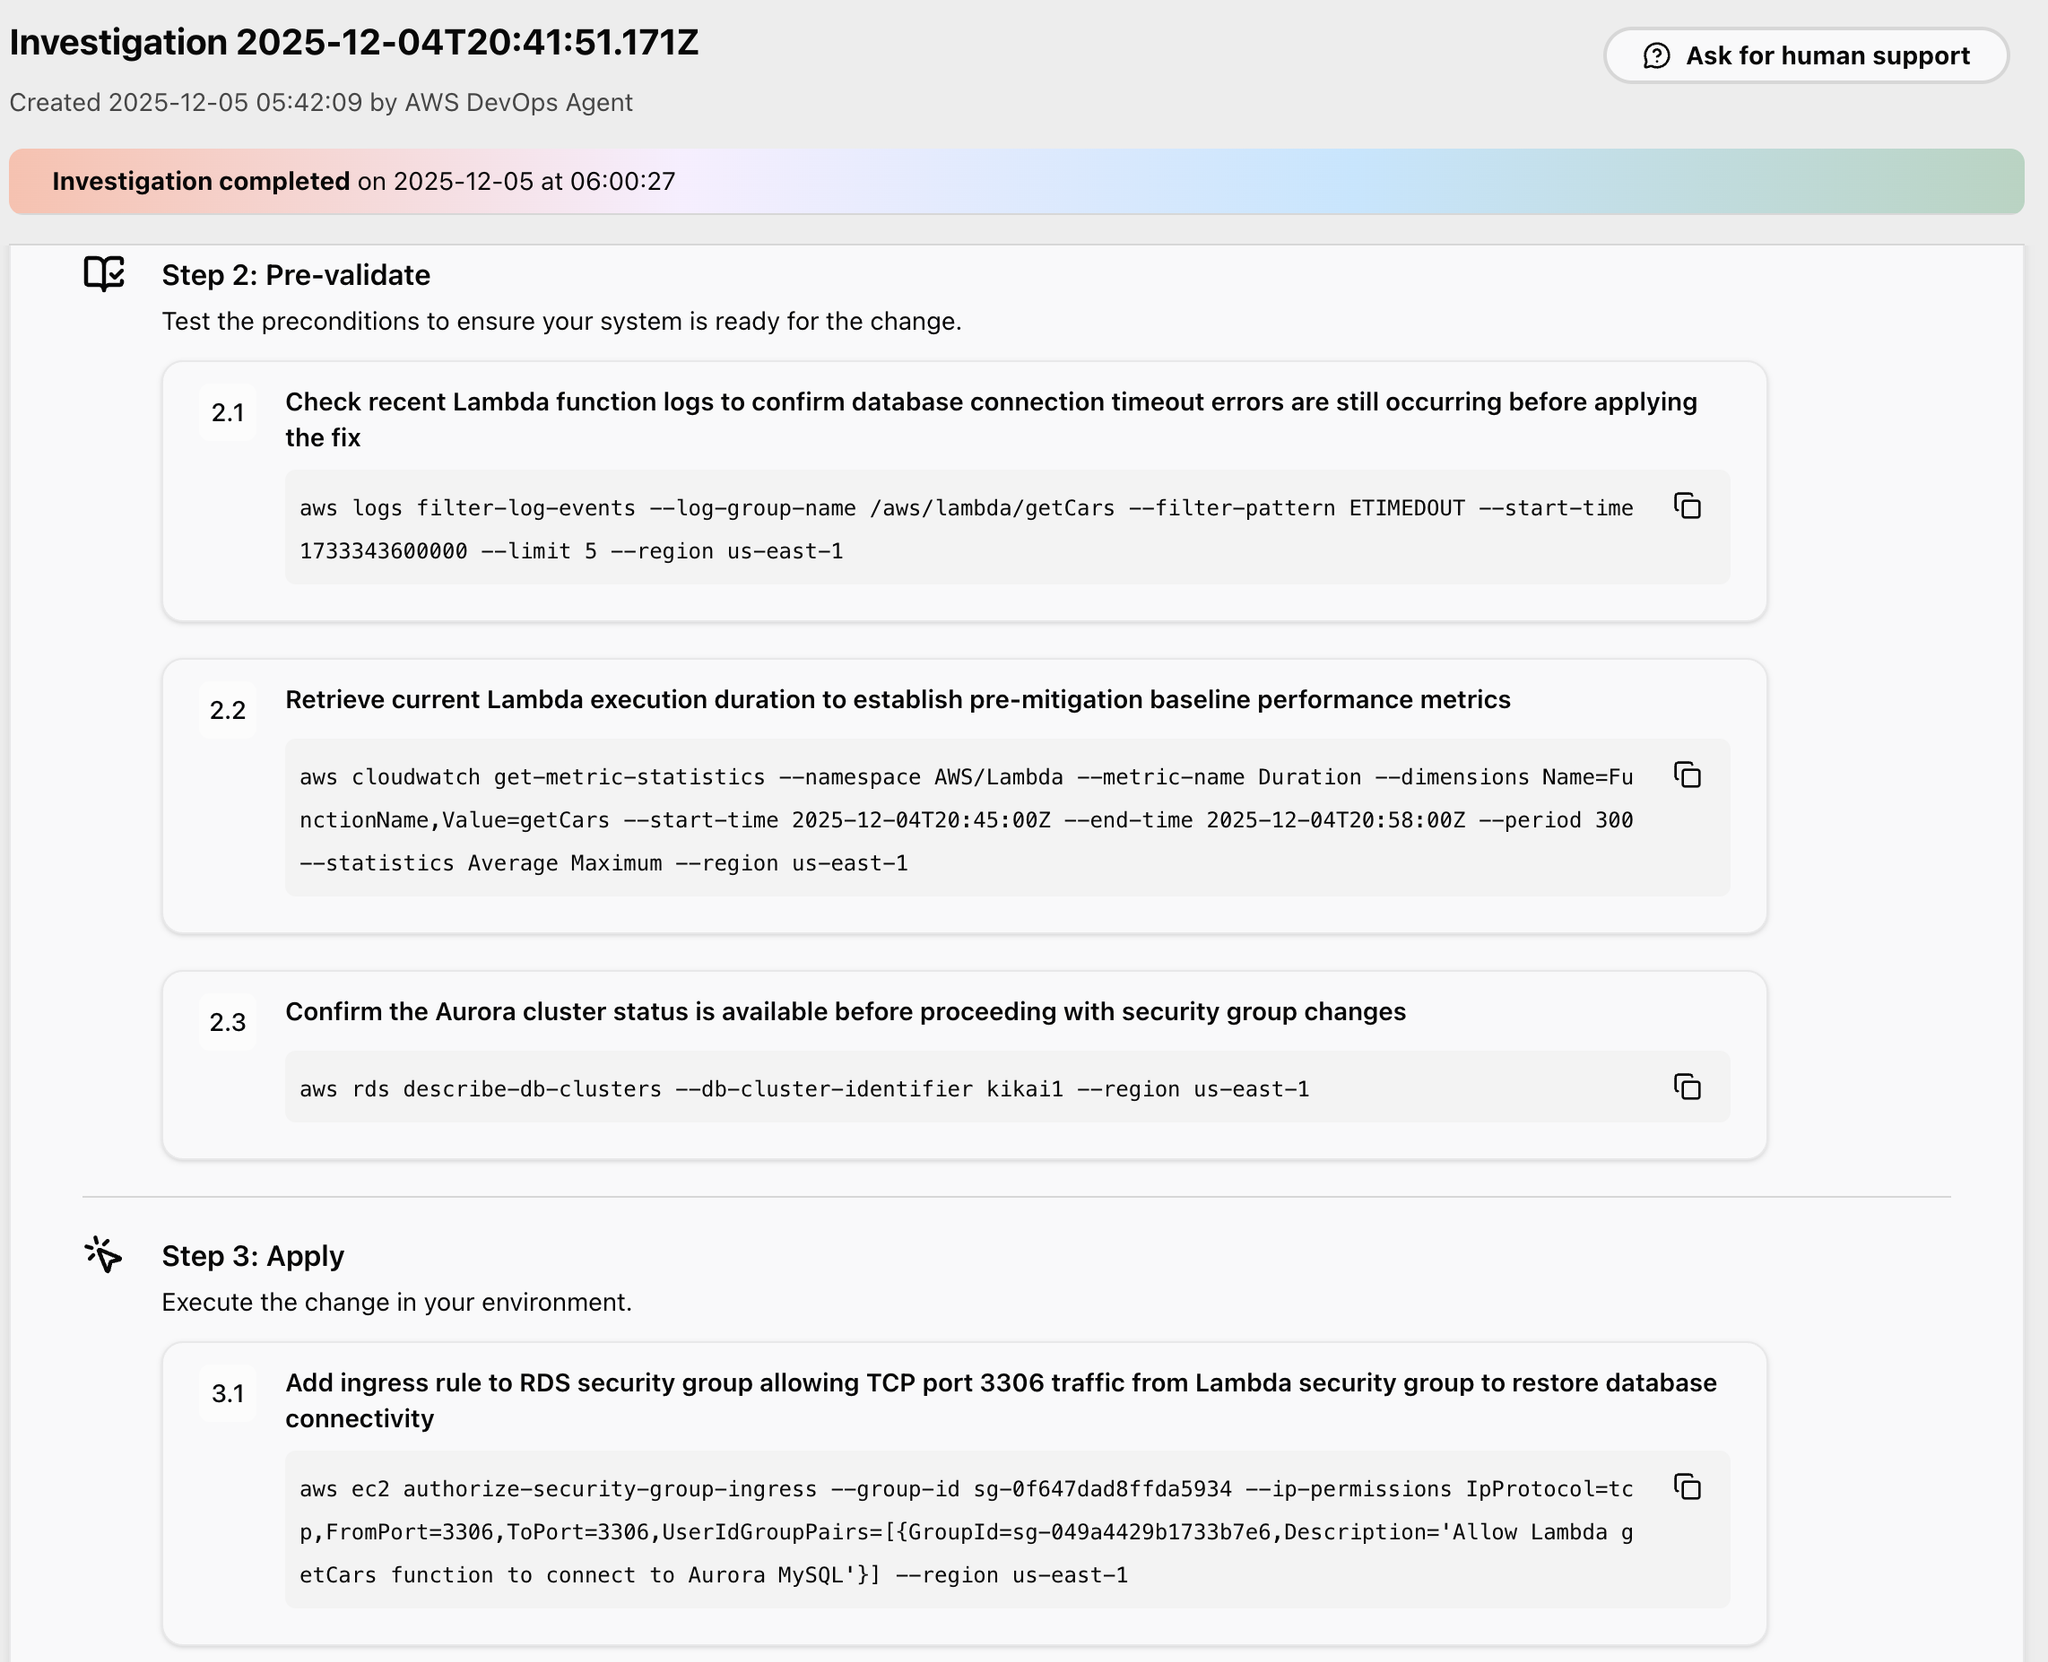
Next, Step 2 suggests using AWS CLI commands to verify whether the outage is still ongoing and whether the Aurora cluster is operational, as a preliminary check.
Step 3 suggests an AWS CLI command to apply the fix.
This command modifies the security group settings.
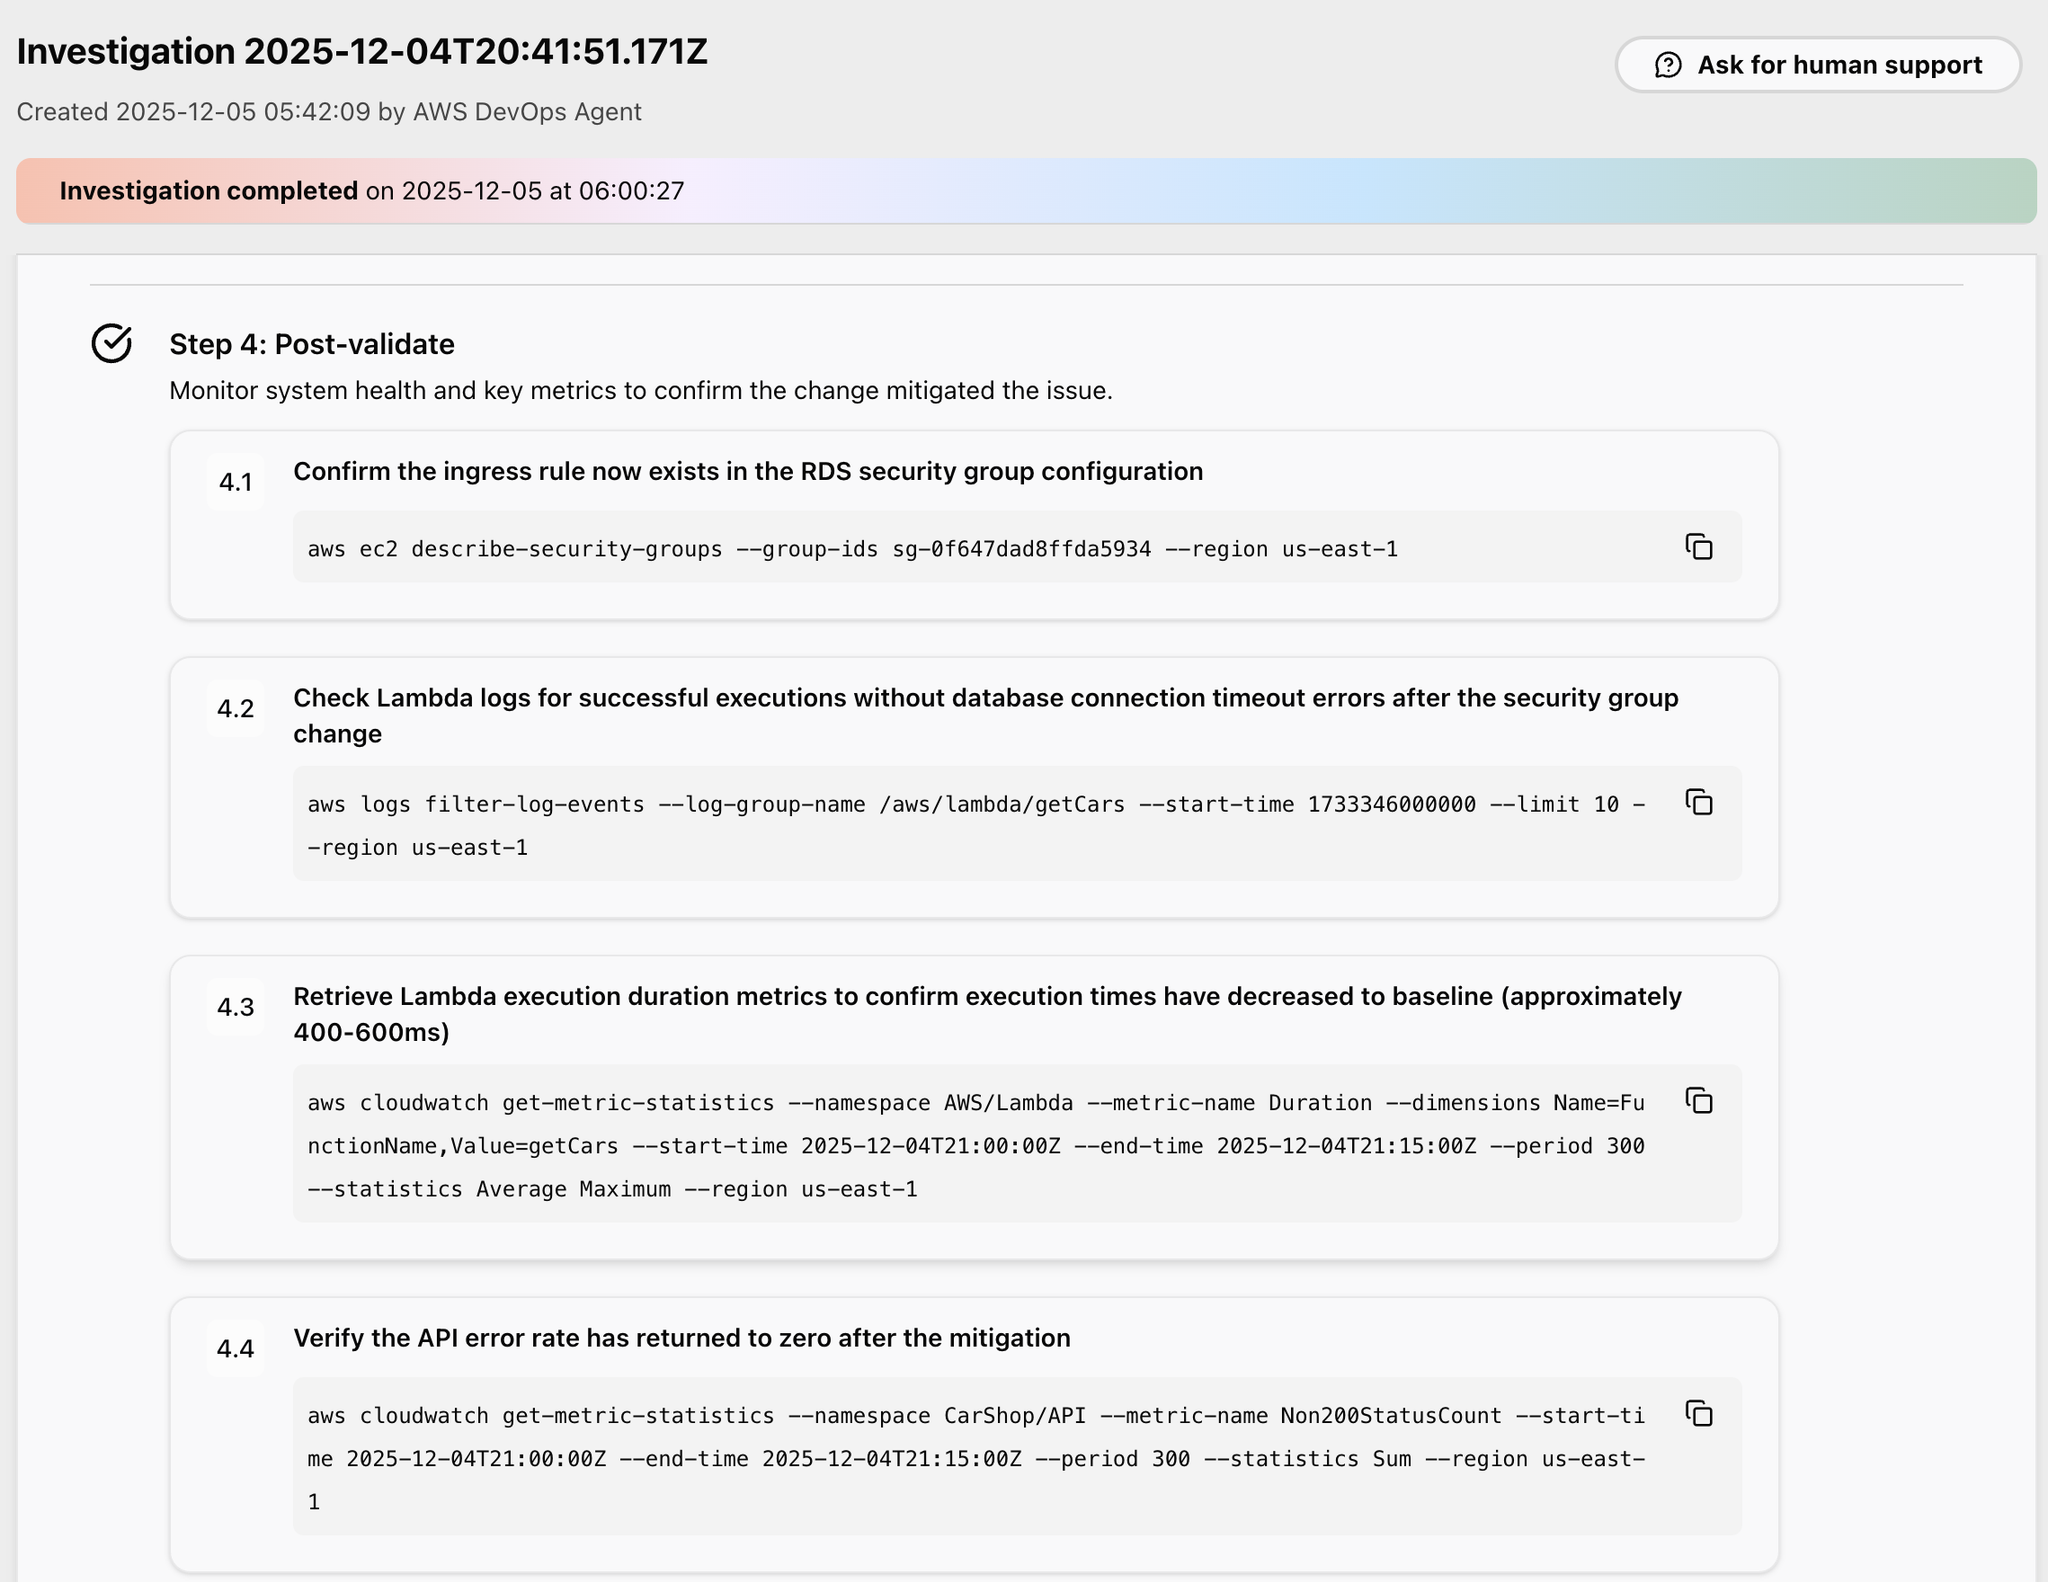
Step 4 suggests AWS CLI commands to perform a post-incident verification and investigate whether the recovery was successful.
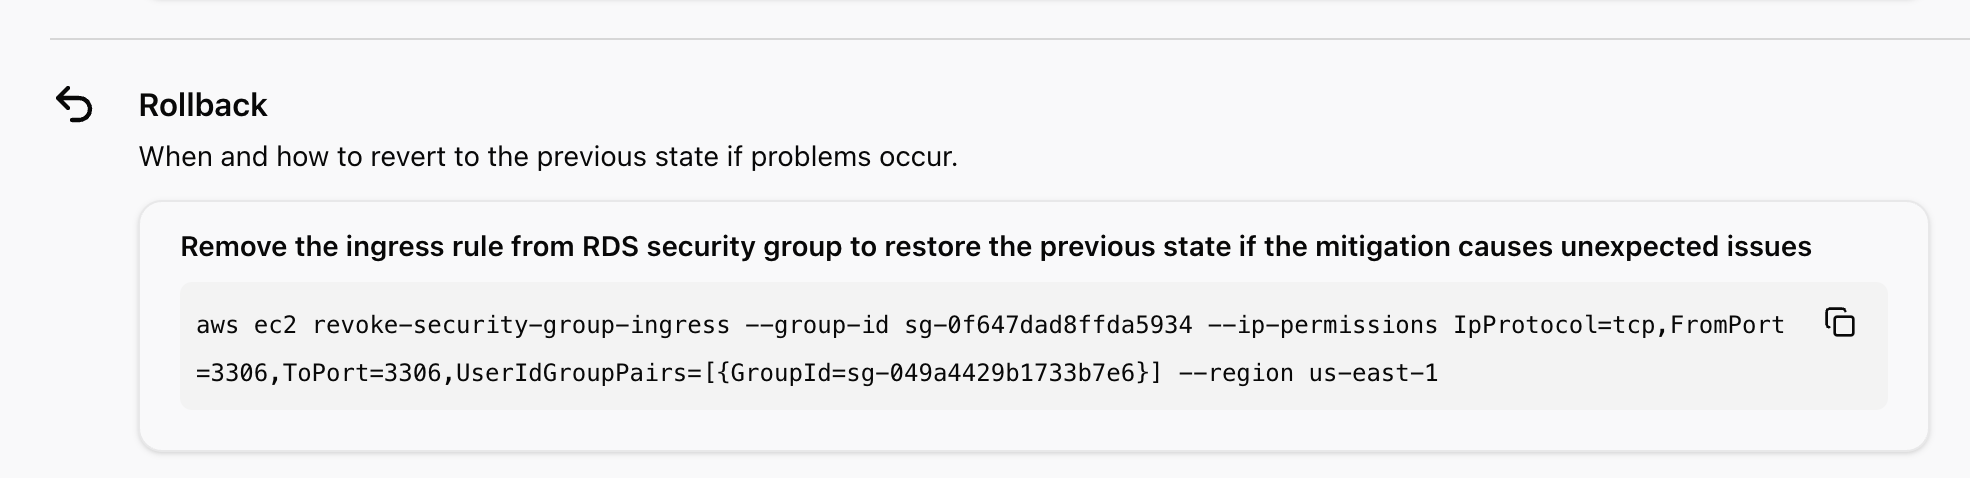
Finally, here's a suggestion for a rollback.
A command is being suggested to revert the security group, which was modified during the recovery suggestion operation, back to its original state.
Basically, you just need to follow steps 1 through 4.
Now, let's try the recovery command suggested in Step 3.
Next, execute the command suggested in Step 4 and check the results.
When I tried accessing the web system again, the display was successfully restored.
Finally, open the Prevention tab in the DevOps Agent and click Run.
Then, we begin investigating whether there are any effective means to prevent the incident.
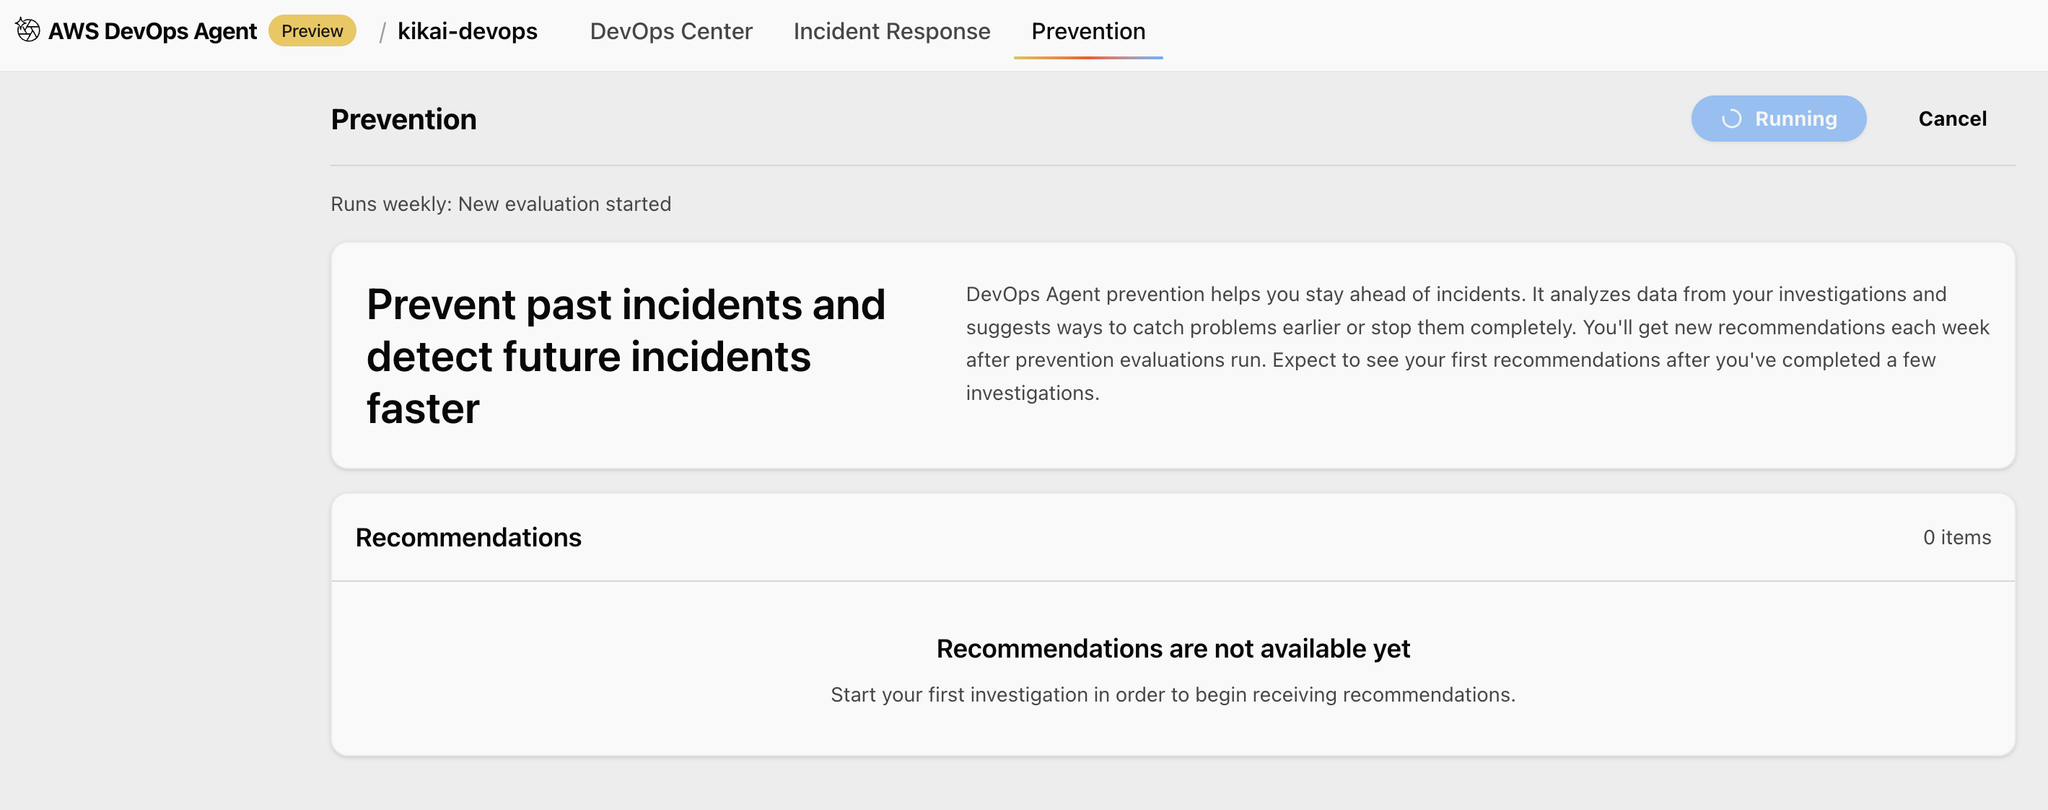
Once completed, you will see a screen like the one below.
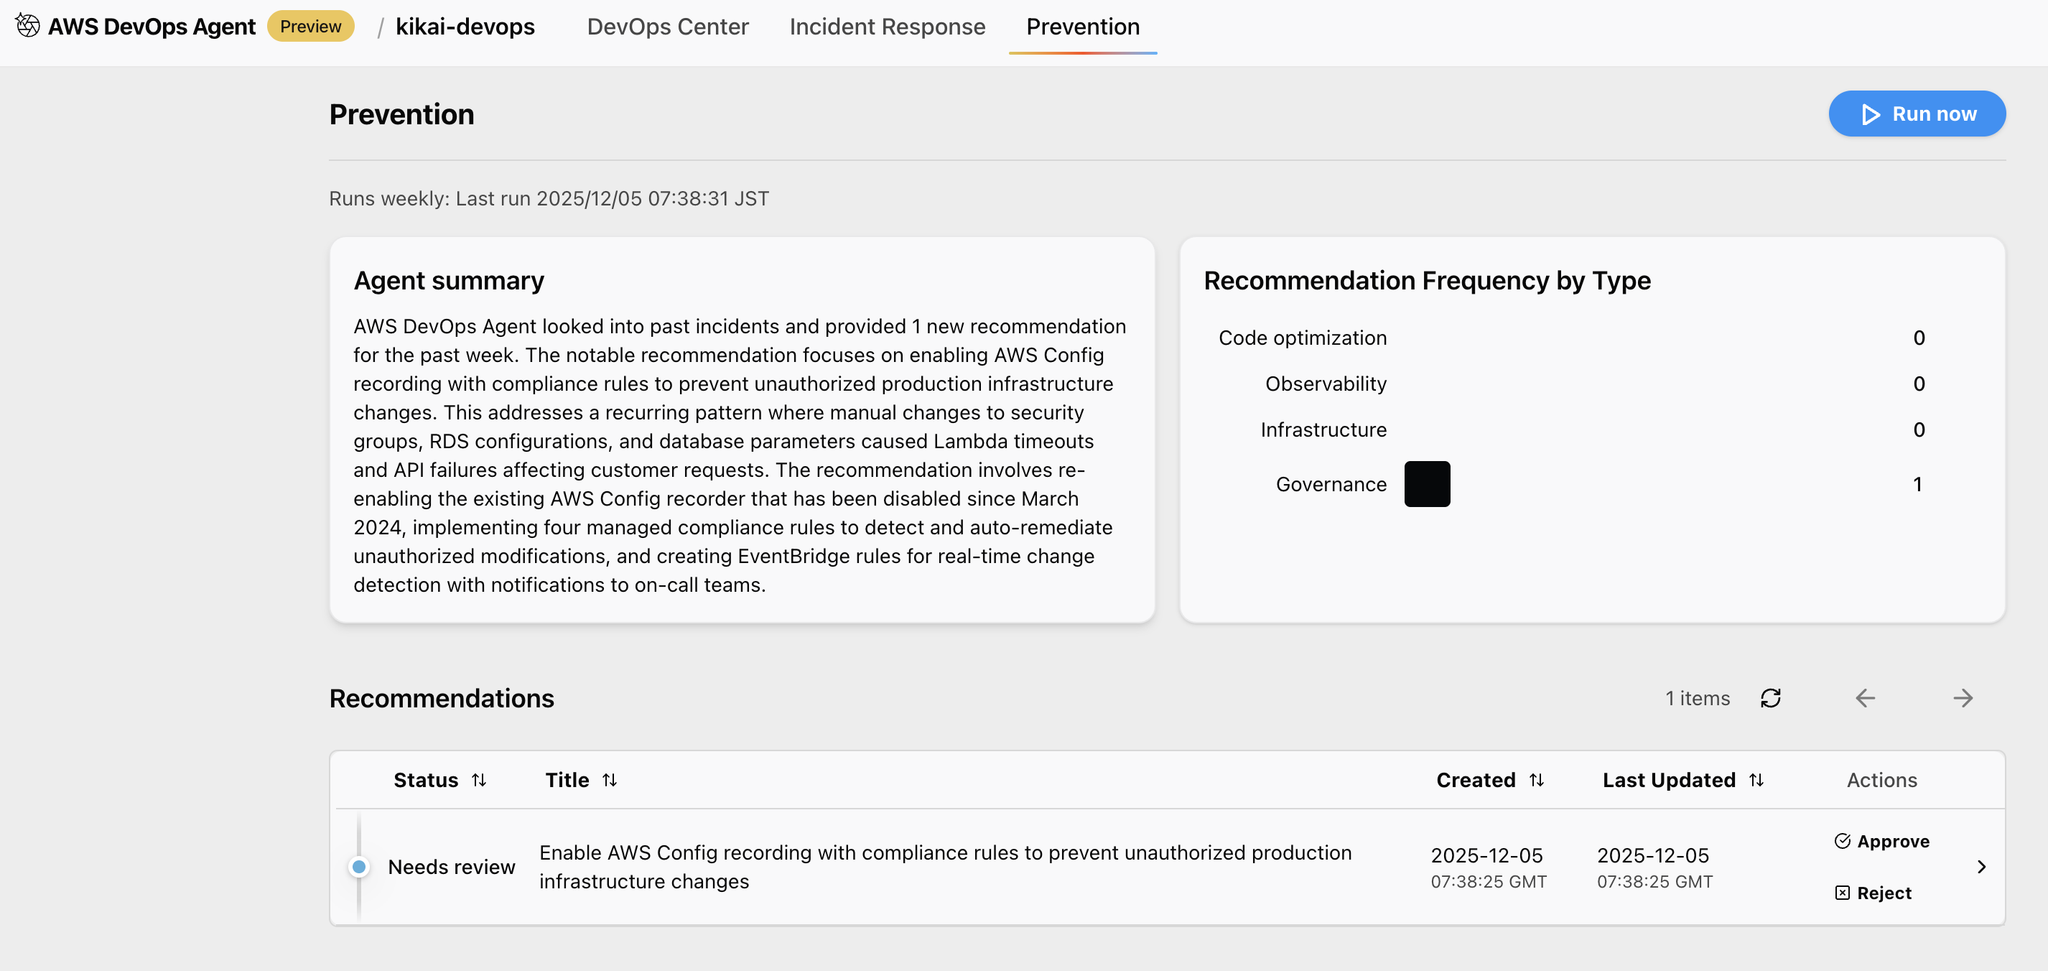
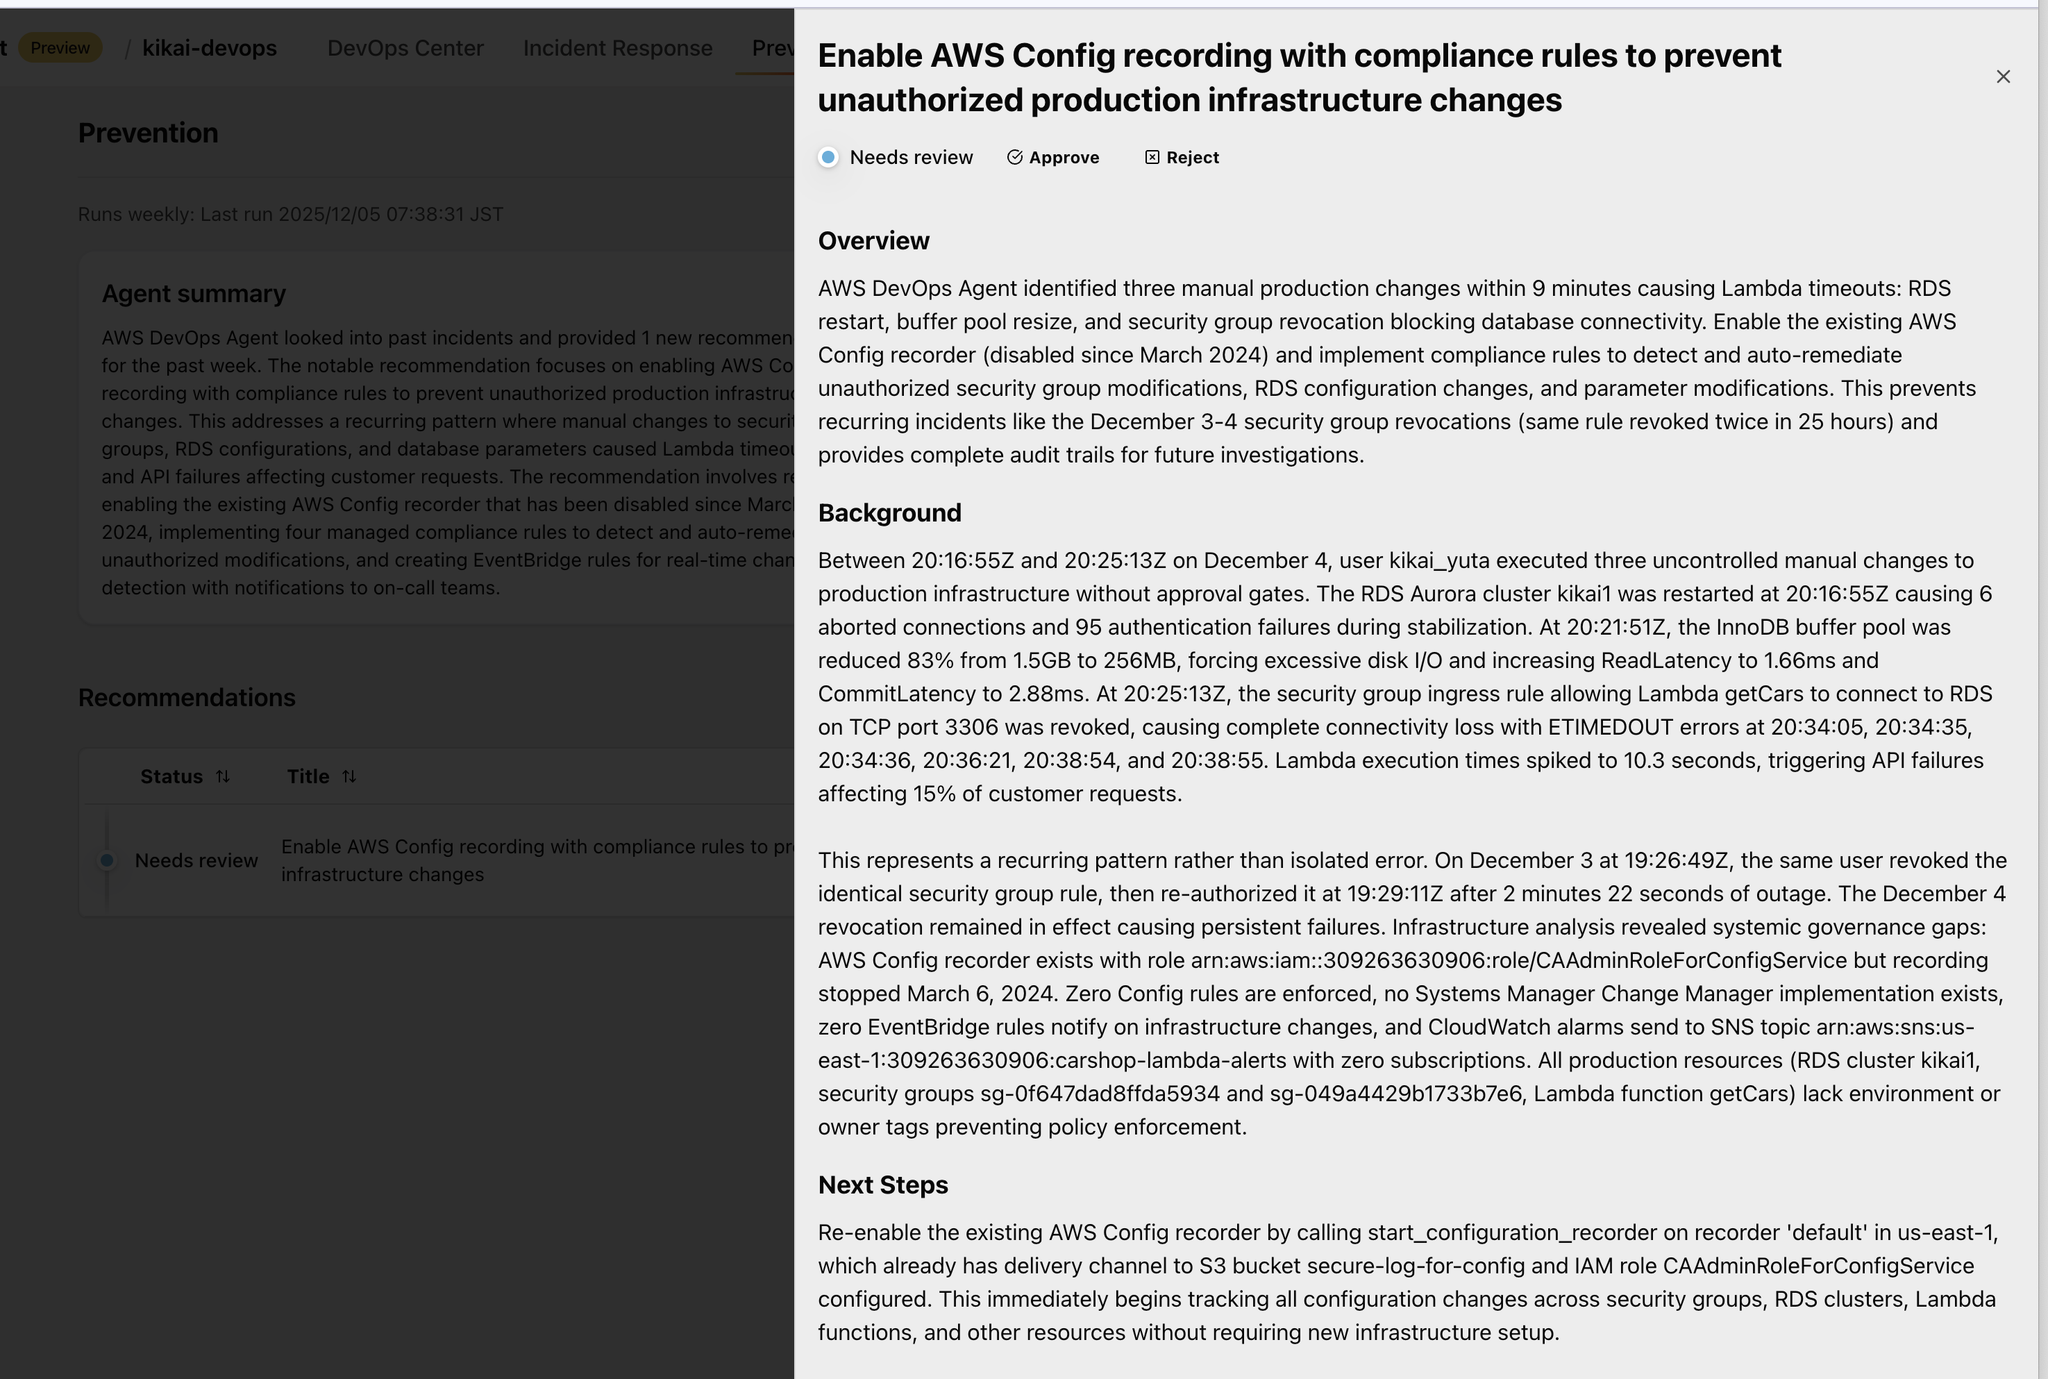
When you open Recommendations, a report of preventative measures is displayed. It offers suggestions on how to prevent the same problem from occurring again.
The above is a brief overview of how to verify the operation of the DevOps Agent.
Although not covered in this article, there is also a Runbook feature.
You can configure this by opening the Agent Space in the DevOps Agent and clicking the gear icon in the upper right corner.
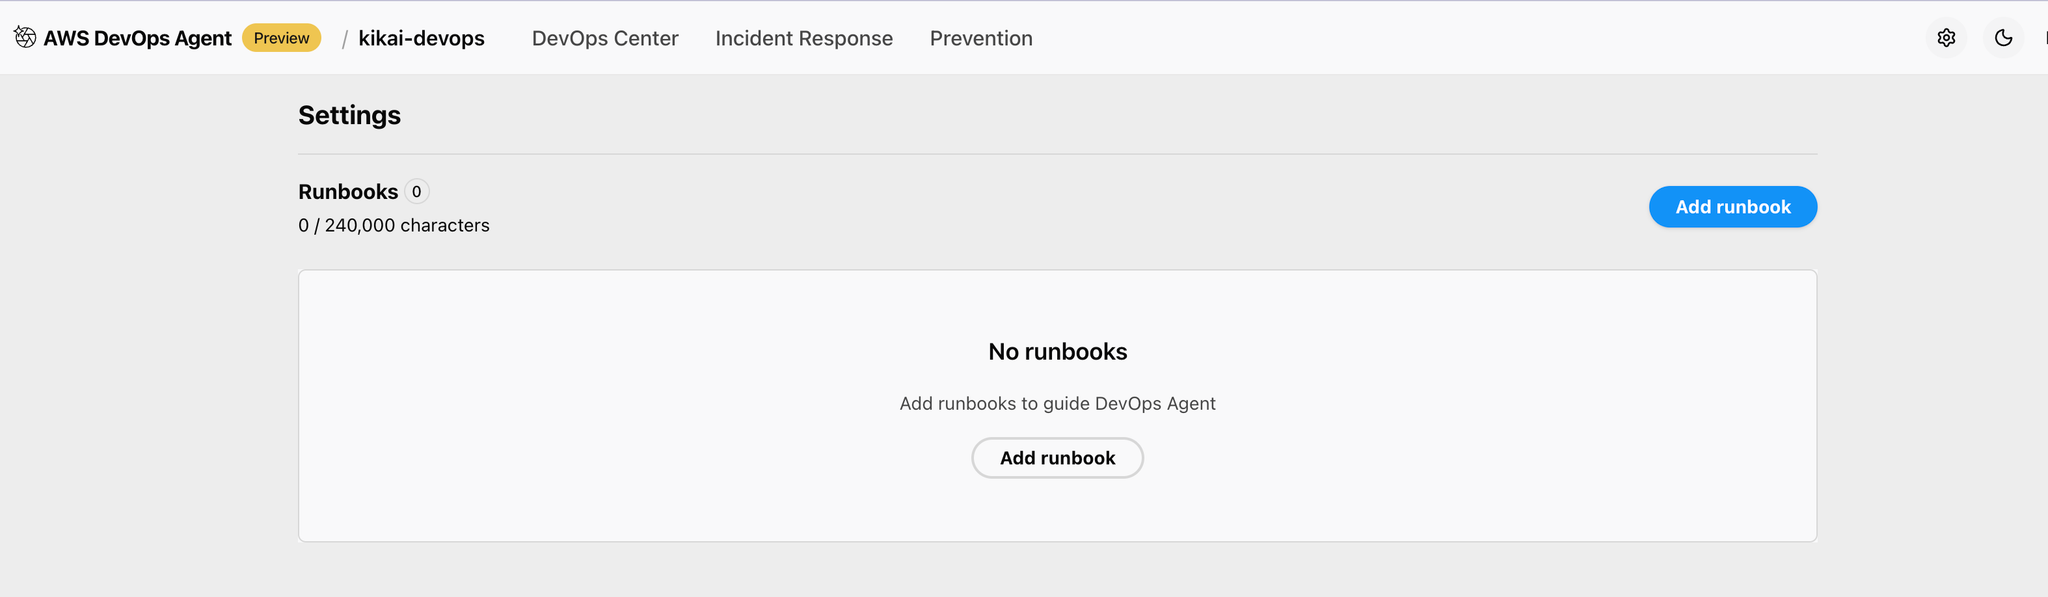
One way to use runbooks is to include service-specific information in Markdown, which allows for more effective investigation of the DevOps Agent.
Examples of information to include in a Runbook:
Current considerations for the DevOps Agent
1. The scope of the DevOps Agent is limited to investigating the root cause of failures, proposing recovery measures, and suggesting preventive measures; executing recovery or preventive measures commands is outside its scope.
The DevOps Agent is not responsible for executing recovery commands.
If you absolutely want automated recovery, you will need to implement your own AI agent and integrate it with the recovery plan proposed by the DevOps Agent.
2. Usage during the preview period is free, but there are limitations.
The DevOps Agent is free to use during the preview period, but the following limitations apply:
- 10 Agent spaces per account
- Monthly incident response time: 20 hours
- Monthly incident prevention time: 10 hours
- 1,000 chat messages per month
3. In its initial state, the system will not initiate an investigation unless you issue a request for it from the DevOps Agent's UI screen.
Even if a CloudWatch alarm is triggered, it won't automatically investigate by default.
There are three main ways to begin an investigation into a system failure.
A. Built-in integrations
It integrates with ticketing systems such as ServiceNow, and automatically starts incident investigations from tickets.
B. WebSockets/Webhooks
The AWS DevOps Agent sends events via WebSockets, automatically triggering alarms from Datadog and Dynatrace.
C. Manually
Start manually from the DevOps Agent Space Web UI
Incident ResponceTo initiate an automated investigation, you need to configure integrations with Datadog, Dynatrace, and New Relic to receive alerts.
4. Differences in the monitoring service provider's response status
Even with the integration of the above monitoring services, the situation varies depending on the service.
Dynatrace
Setup is possible simply by linking your Dynatrace account.
This is because AWS is hosting the Dynatrace MCP server for the DevOps Agent.
Datadog
Using Datadog's Remote MCP server is required. However, it is currently in a private preview state available upon request.Only a limited number of customers can use it.is.
New Relic
This requires the use of a Remote MCP server on the New Relic side. Since it's in public preview, it's available to general users.
Splunk
Using a Remote MCP server on the Splunk side is required.
CloudWatch
It is not currently possible to trigger a DevOps Agent failure investigation using CloudWatch alone.
You will need to use CloudWatch alarms as triggers to connect to the DevOps Agent via a webhook through EventBridge/Lambda or similar services.
5. We cannot investigate the contents of the EC2 server.
While the DevOps Agent can investigate CloudWatch logs, metrics, and the status of individual components, it cannot directly check logs or process status within EC2 servers.
Let's say you have Apache, Tomcat, and MySQL running on the same EC2 server, and MySQL is experiencing a surge in load.
The DevOps Agent can tell us that the CPU load on the EC2 server is high, but it cannot tell us what the cause is.
To properly report the load status of EC2 servers, you need to send detailed metrics to an external service such as Datadog, and have the DevOps Agent investigate them via that data.
In conclusion
The DevOps Agent enables the automation of troubleshooting and proposing recovery procedures. It's a very promising product!
Since this is still a preview release, let's actively try it out and send feedback to AWS!
If you are interested in SRG, please contact us here.