"Tosage" visualizes how much AI your team is using
#SRG(Service Reliability Group) is a group that mainly provides cross-sectional support for the infrastructure of our media services, improving existing services, launching new ones, and contributing to OSS.
This article introduces "tosage," an open source software that visualizes a team's use of AI tools, and supports data-based productivity improvement and cost management.
Introduction
In recent years, AI-based development support tools such as Cursor, Vertex AI, and Amazon Bedrock have rapidly become popular and are used in many development environments.
These tools have the potential to dramatically improve developer productivity, but they also create new challenges, such as the difficulty of accurately determining which AI tools are being used and to what extent by team or department.
To solve this problem, we developed "tosage," a tool that allows teams to easily visualize their AI usage.
What is tosage?
tosage is a daemon-based application that collects usage information (token amounts) from major AI development tools and sends it to the monitoring system Prometheus.
It runs continuously in the background, aggregating usage data from each tool.
Supported services
Currently, tosage supports token amount collection for the following services:
- Cursor
- Claude Code
- Google Cloud Vertex AI
- Amazon Bedrock
You can centrally manage usage data collected from these tools.
Simple architecture
The main feature of tosage is its simple architecture.
Typically, an intermediate component called a PushGateway is used to send metrics from short-lived jobs to Prometheus, but tosage does not require this.
It uses a mechanism where a locally running daemon sends metrics directly to Prometheus's Remote Write endpoint.
This enables near real-time data collection without complicating the monitoring system configuration.
Easy visualization with Grafana
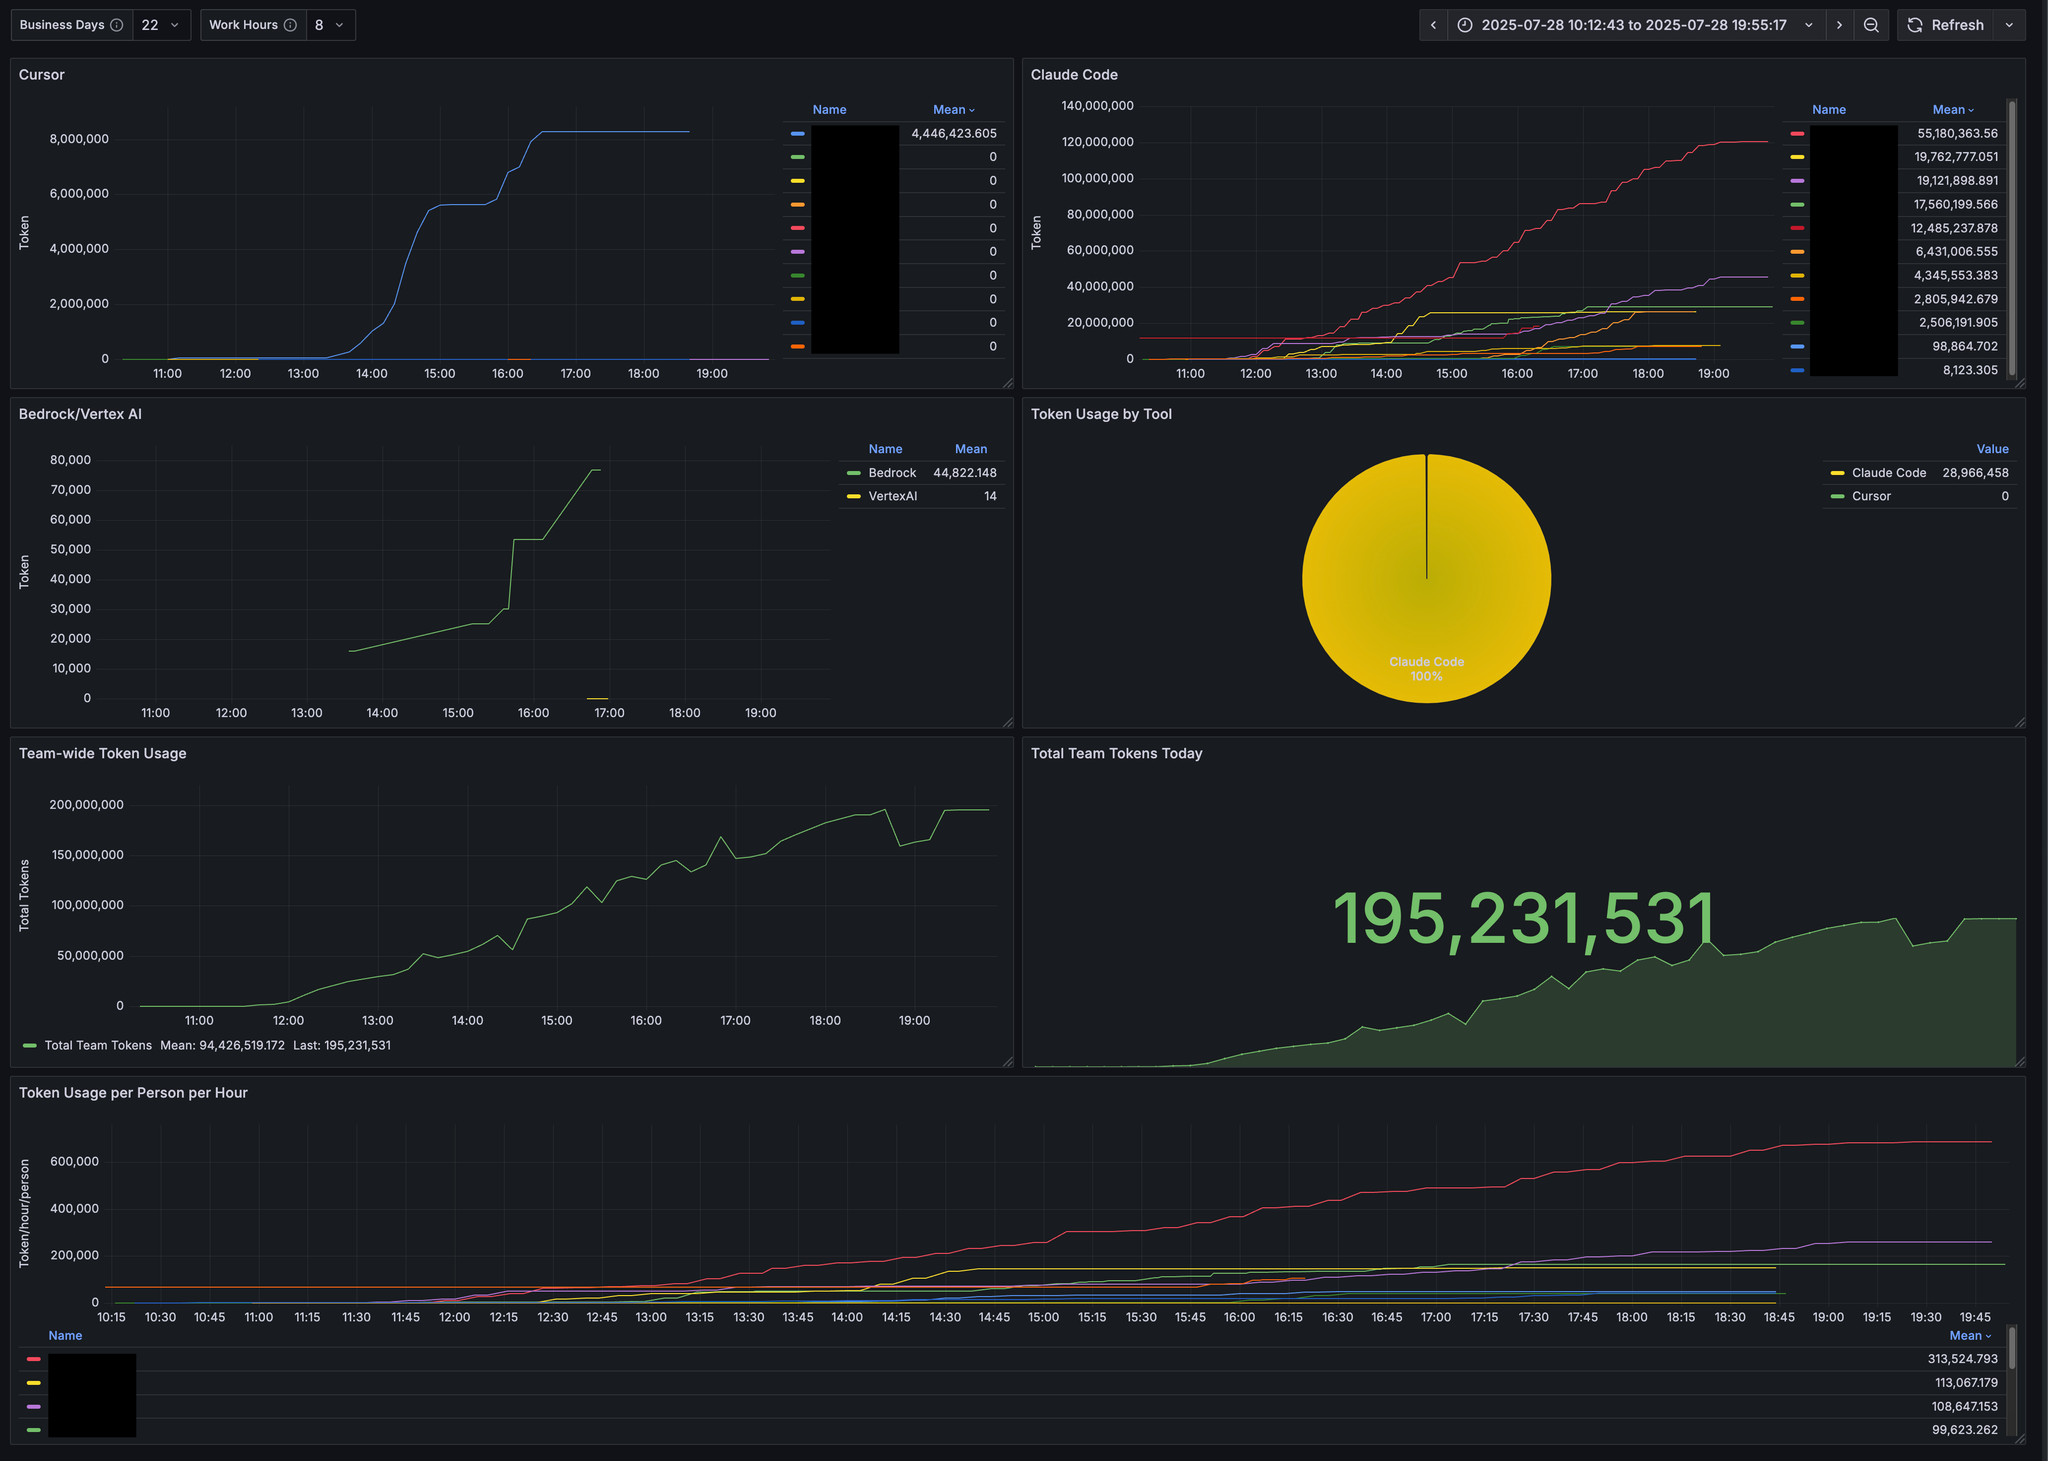
The data collected by tosage is intended to be visualized in a dashboard using Grafana.
We also provide ready-to-use Grafana dashboard templates to help you intuitively understand usage.
By using this dashboard, you can check usage volume and trends for each user and AI model at a glance, enabling data-based analysis.
Easy to implement
You can install it with just the command below.
tosage sends metrics to Prometheus.
If you do not have a Prometheus environment, we recommend using Grafana Cloud.
Grafana Cloud offers a free plan that is sufficient for individuals and small teams.
By combining tosage with the free plan of Grafana Cloud, you can quickly build a visualization environment for AI usage without incurring additional infrastructure costs. (Not PR)
privacy
The metric label sent will have host(hostname) attached.
However, if your hostname can be used to identify you personally, you can specify your preferred host label in your configuration.
Our team's usage on a certain day
This day was the day we held team working groups, and it was fun to see the unique features of each, with some people using Cursor, others using Claude Code, and others using Bedrock.
It seems that 200 million tokens were used on that day.

If your company has signed up for an AI tool, you may want to review the contract to see if it is actually being used.
summary
In this article, we introduced "tosage," a tool that visualizes a team's AI usage.
All of the code for this tosage, a total of 15,000 lines, was created using vibe coding.
By introducing tosage, you can make data-driven decisions about which AI tools are contributing to improving your team's productivity and use the data to help manage future costs.
tosage is available as open source, so we hope it will be useful to many development teams that actively use AI tools.
We also welcome PRs that use AI, such as bug reports and feature additions.
SRG is looking for people to work with us.
If you are interested, please contact us here.
