The path to performance optimization for ArgoCD in HA configurations
#SRGThe Service Reliability Group primarily provides comprehensive support for the infrastructure surrounding our media services, focusing on improving existing services, launching new ones, and contributing to open-source software (OSS).
This article introduces methods for addressing the performance challenges of ArgoCD in HA configurations. Specifically, it explains optimization techniques to cope with deployment delays caused by increased resources and how to implement load balancing using sharding.
I hope this is of some help.
ArgoCD is slowOne day, I noticed a delay in the deployment.Current Situation SurveySurvey resultsWhat should I do?Factors affecting ArgoCD performanceArgoCD's main componentsCore metricsElement 1: Number of RepoServersElement 2: Reconcile intervalElement 3: Adjusting the number of controller processorsElement 4: Kubernetes API Server Request RelatedElement 5: Using Helm/Kustomize and MonoRepoElement 6: Number of Application Controllers (Number of Shards)Try Sharding againComparison of Sharding algorithmsSharding optimal solutionImprovement resultsBefore actionShard activation first stepShard activation, second stageSharding experiment and application of optimal solutionOther adjustmentsUI performanceProblems with unmanaged resourcesIn conclusion
ArgoCD is slow
It's already been four years since we migrated the continuous delivery (CD) functionality of our Product A to ArgoCD. During this time, the number of services migrated from legacy systems has continued to increase, and the resources managed in our CD environment have expanded rapidly. While deployments were smooth at the beginning of the migration, new challenges that have emerged in recent years have highlighted the need for optimization.
One day, I noticed a delay in the deployment.
One day, a backend developer reported that deployment was taking over 30 minutes. I immediately checked the ArgoCD UI and was confronted with a shocking situation.
Context deadline exceededCurrent Situation Survey
Project/ApplicationSetApplication source repos are divided into three categories depending on their purpose.
- ArgoCD Application Definition (Helm Chart)
- Application Manifest (Kustomize)
- Cluster Component CRD Manifest (Kustomize + Helm Chart)
We have approximately 250 applications and manage and track approximately 30,000 resources via ArgoCD.
The ArgoCD configuration is the default HA configuration.
Survey results
90%error during container init: error setting cgroup config for procHooks process: unable to freeze: unknowFurthermore, there was no dedicated monitoring system for ArgoCD.
What should I do?
First, I decided to collect metrics for ArgoCD-related Pods and create a dedicated dashboard in Datadog.
By adding the following annotation to your PodTemplateSpec, you can view metrics on the ArgoCD dashboard provided by Datadog. For more details, please see this link.
The collectible metrics differ from those of Prometheus, so for details, see here.listThis is what it will be.
The ArgoCD Application Controller's lack of scalability is quite noticeable. As we continued our investigation, we felt the need to reconsider the ArgoCD HA configuration, and conducted a detailed investigation based on several reference materials.
- These are the guidelines for HA configurations found in the official ArgoCD documentation. They are particularly detailed and cover all possibilities, but configurations may change depending on the version, so you need to proceed while checking the version and release notes.
- Sync 10,000 Argo CD Applications in One Shot. By Jun Duan, Paolo Dettori, Andy Anderson: This document presents a quantitative study on the scalability of ArgoCD. It includes benchmarks on performance when syncing 10,000 applications, as well as experimental data on the number of RepoServers and reconcile intervals, making it a very useful indicator of the load on ArgoCD application management.
- Argo CD Benchmarking Series. By Andrew Lee: This is the most comprehensive analysis of the factors influencing ArgoCD performance. It helped us identify the bottleneck in this case.
Factors affecting ArgoCD performance
ArgoCD's main components
To understand the performance of Argo CD, it is essential to have a precise understanding of the roles and operations of its key components.
API Server()
role:
- It acts as an authentication and authorization gateway, accepting all operation requests.
- Handling requests from CLI, Web UI, or Webhooks.
AppProject
Operation:
- API requests can be received via UI, CLI, or Git Webhook events, etc.
- Authenticate users using JWT and SSO, and apply RBAC policies.
- Perform CRUD operations on Application CRD resources according to the request.
2. Repo Server()
role:
- Retrieve source code from a Git repository and generate a Kubernetes manifest.
- It handles various source formats such as Helm, Kustomize, and Plain YAML.
Operation:
- In response to a request from the Application Controller, retrieve source code from the specified Git repository and revision.
- Use tools like Helm or Kustomize to generate Kubernetes manifests.
- Cache the generated manifest to the local file system.
- Store some information (the hash value of the manifest) in memory.
3. Application Controller()
role:
Application
- Properly create, update, and delete resources on a Kubernetes cluster.
Operation:
Application
Application- Call the Repo Server and retrieve the latest manifest (Desired State).
- Retrieve the current resource state (Live State) via the Kubernetes API.
- Compare the Desired State and the Live State and calculate the difference.
- Based on the differences, determine the necessary resource CRUD operations.
Core metrics
Application Controller
- Workqueue Work Duration Seconds
argocd.app_controller.workqueue.work.duration.seconds.bucketThis metric shows the time it takes for the ArgoCD Application Controller to process items within the WorkQueue. Long processing times may indicate a bottleneck and should be monitored.
- Workqueue Depth
- This is a queue where ArgoCD performs Reconcile to maintain manifest consistency between the Git repository and Redis. It synchronizes the state and cache of the Git repository. If the repository changes frequently, processing this queue may take some time.
- ArgoCD is a queue that maintains manifest consistency between Redis and Kubernetes clusters, and performs application syncing and deployment.
argocd.app_controller.workqueue.depthapp_operation_processing_queueapp_Reconcile_queueapp_operation_processing_queueThe two queues mentioned above are processed according to the number of processors. See element 3 for details.
- Process CPU Seconds
argocd.app_controller.process.cpu.seconds.countThis metric shows the CPU time consumed by the Application Controller. If you are using multiple Application Controllers, you can monitor performance by taking the average. Kubernetes Pod CPU metrics can also be used as an alternative.
RepoServer
- Git Request Duration Seconds
argocd.repo_server.git.request.duration.seconds.bucketThis metric indicates the time it takes for the ArgoCD Repo Server to process Git requests. If accessing the Git repository takes a long time, sync delays may occur.
Element 1: Number of RepoServers
To improve ArgoCD performance, increasing the number of replicas in the Repo Server is effective. Increasing the number of replicas reduces the overall application sync time. Appropriately increasing the number of replicas parallelizes manifest generation and speeds up the sync process.
The article "Sync 10,000 Argo CD Applications in One Shot" reports that tripling the number of replicas reduced the overall sync time by a third.
Element 2: Reconcile interval
app_Reconcile_queueIn the first round of Argo CD Benchmarking, the sync process, which normally takes 30 minutes to complete, was shortened to 6 to 12 minutes by increasing the reconcile interval from 3 minutes to 6 minutes, resulting in zero OutOfSync errors.
Element 3:Adjusting the number of controller processors
controller.operation.processors- controller.status.processors: Number of processors for monitoring and updating the application status
appRefreshQueue(app_Reconcile_queue)
- controller.operation.processors: Number of processors performing operations on Kubernetes
appOperationQueue(app_operation_processing_queue)
By default, it supports 400 applications.controller.status.processors20,controller.operation.processorsIt is set to 10. In the case of 1000 applications,controller.status.processors50、controller.operation.processors25 designations are recommended.
The second article in the Argo CD Benchmarking series reports that doubling the number of processors reduced sync time by 33%. However, when increasing the number of processors, it is important to balance this with the processing capacity for requests to the Kubernetes API server (Kubernetes Client QPS/Burst). If increasing the number of processors does not show any improvement, adjusting the Kubernetes Client QPS/Burst settings is recommended.
Element 4: Kubernetes API Server Request Related
K8S_CLIENT_BURSTK8S_CLIENT_BURST- Twice the default settings: 67% reduction in sync time.
- Three times the default settings: 77% reduction in sync time.
K8S_CLIENT_BURSTARGOCD_K8S_CLIENT_QPS/ARGOCD_K8S_CLIENT_BURST
Element 5: Using Helm/Kustomize and MonoRepo
When generating application manifests using Helm or Kustomize, performance can be particularly impacted in MonoRepo environments. Because MonoRepo contains multiple applications and deals with the entire repository, the generation process becomes complex.
The Repo Server clones the Git repository locally and generates a manifest. If the manifest generation requires changes to the repository files, only one parallel process is allowed per Repo Server replica. This becomes a bottleneck and degrades performance if there are many applications in the monorepo.
In particular, in monorepo environments containing 50 or more applications, this concurrency limit often slows down processing when multiple manifest generation processes occur. If you are using Helm or Kustomize and employing a monorepo, you need to configure your system to take this limitation into account.
Element 6: Number of Application Controllers (Number of Shards)
ArgoCD's Application Controllers are deployed as StatefulSets, and scaling out is achieved using a sharding approach. By utilizing multiple Application Controller Shards, load balancing and performance improvements can be achieved.
The ArgoCD HA documentation recommended sharding if the Application Controller was managing multiple clusters or consuming a large amount of memory.
If the controller is managing too many clusters and uses too much memory then you can shard clusters across multiple controller replicas.
Application Controller sharding is currently supported by the following three algorithms:
Lagacy
uidRound-robin
This is a simple algorithm that distributes applications evenly across all shards. This algorithm is widely used in OS scheduling and other applications, and it distributes applications without considering priority. ArgoCD assigns a number to all applications and distributes them across all shards in that order. However, when managing multiple clusters, distribution is performed on a cluster-by-cluster basis. The round-robin method is available from version 2.8.x onwards.
Consistent-hashing
Consistent hashing is used to distribute the application. In addition to even load balancing, it has the advantage of minimizing resource reallocation when shards or clusters are added or removed. Consistent hashing also distributes resources on a cluster basis, without considering priority. Consistent hashing is available from version 2.12.x onwards.
As I will show with real-world data later, the three algorithms mentioned above are not optimal in the following cases.
- When managing multiple clusters and clusters have priorities
- When managing multiple clusters, and each cluster has different resource requirements.
- When the application's resource usage changes dynamically
In the second round of ArgoCD Benchmarking, we compared three algorithms using CPU and memory variability as evaluation criteria. As a result, Consistent-hashing showed the most stable performance.
Sharding settings are configured in the following three places:
ARGOCD_CONTROLLER_REPLICAS
- StatefulSet replica count
controller.sharding.algorithm
Try Sharding again
The three currently used sharding algorithms are all designed to distribute resources evenly. However, in multi-cluster environments, they can only handle distribution on a cluster-by-cluster basis. As a result, performance is often not optimized when there are differences in priority or resource allocation between clusters. This issue has been raised in GitHub Issues for many years, expressing dissatisfaction with the algorithms.
We encountered this very limitation of the Sharding algorithm in our initial implementation.
Comparison of Sharding algorithms
Product A consists of multiple clusters. Each cluster has a different priority and a different number of resources. The cluster list on the ArgoCD side is as follows:
dev-eks
stg-eks
prd-eks
sbx-eks
shd-eks
local
ClusterSecretshd-eksProject/Application/ApplicationSetshd-eksLegacystg-eksstg-eksShard数 < クラスタ数Round-RobinSharding optimal solution
Increasing the number of shards can reduce the risk of high-load clusters being placed on the same shard, but it does not completely solve the problems based on cluster prioritization.
ClusterSecretクラスタ数 = Shard数Furthermore, the following points must be mentioned as disadvantages of sharding:
- If a shard stops, its tasks are not taken over by other shards.
Therefore, monitoring the Pods on each Shard becomes extremely important.
DeploymentImprovement results
Here are some of the key core metrics that show the results of this improvement.
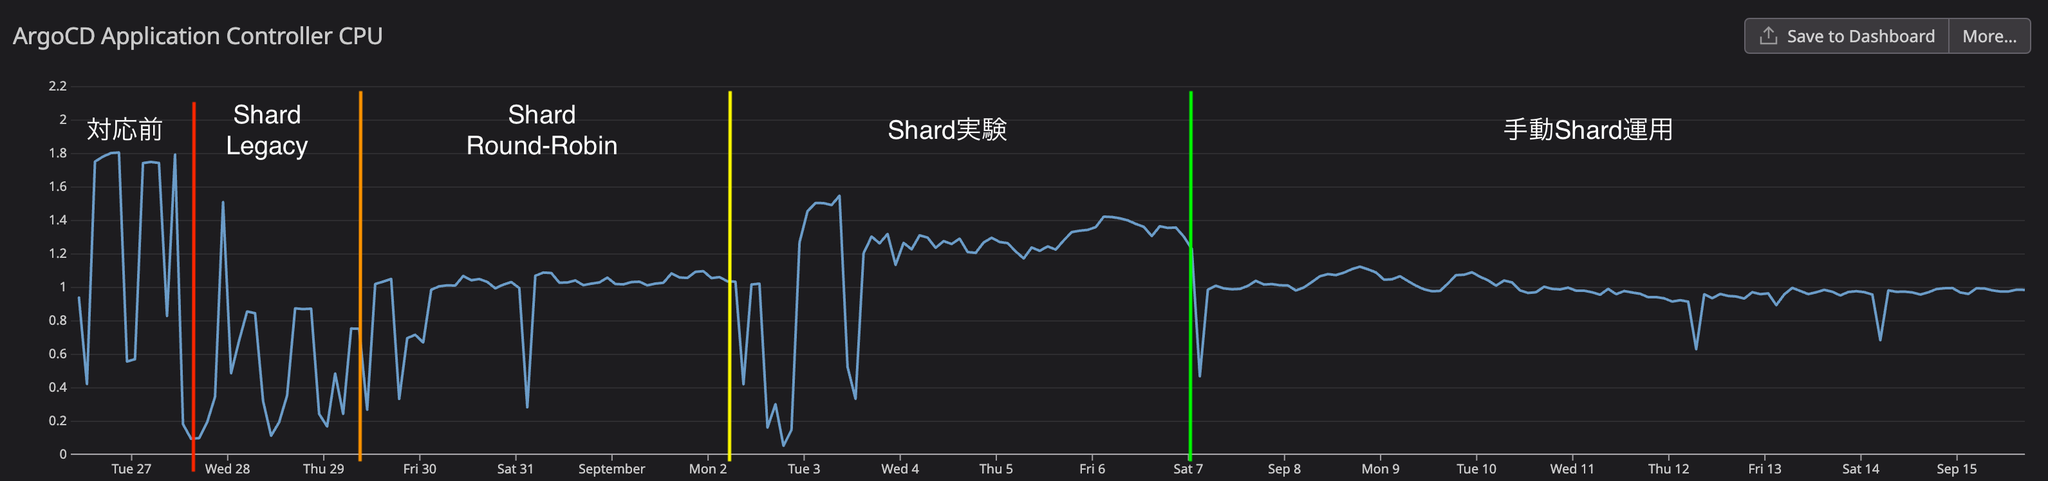
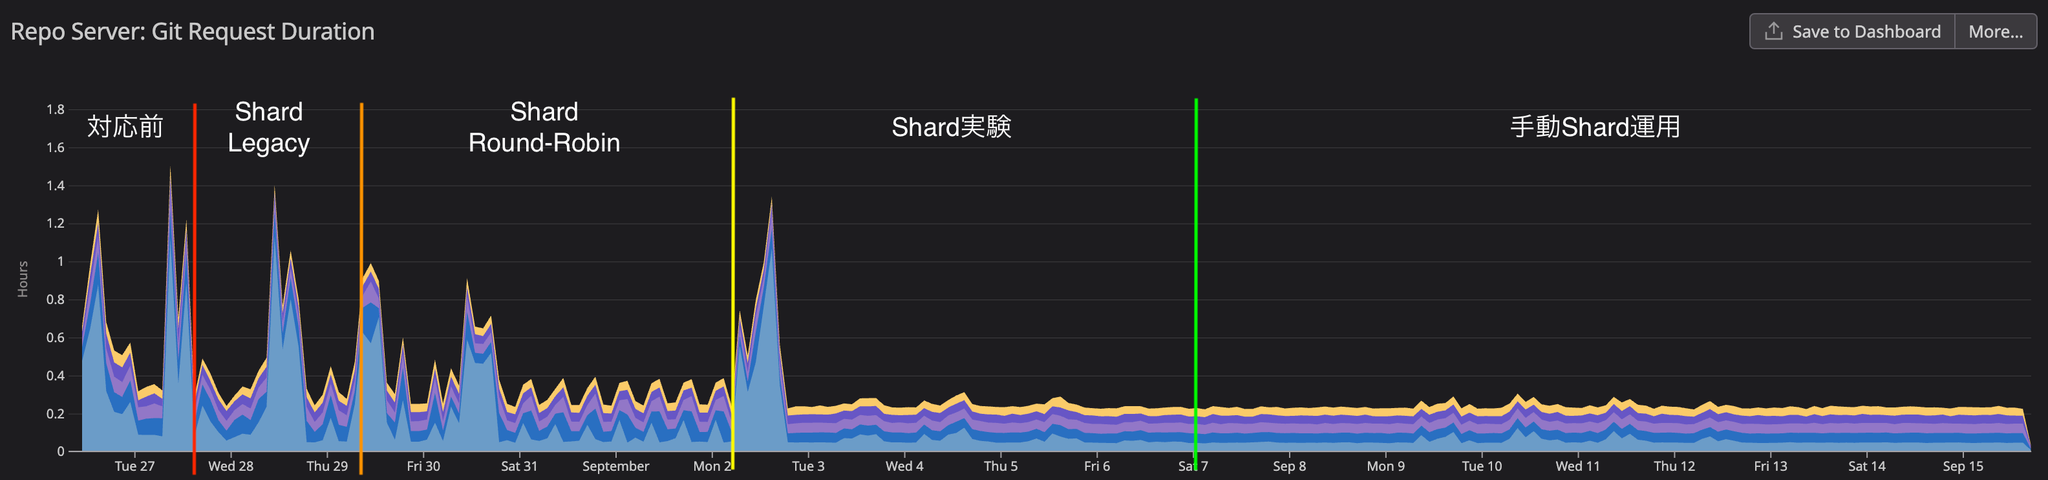
Before action
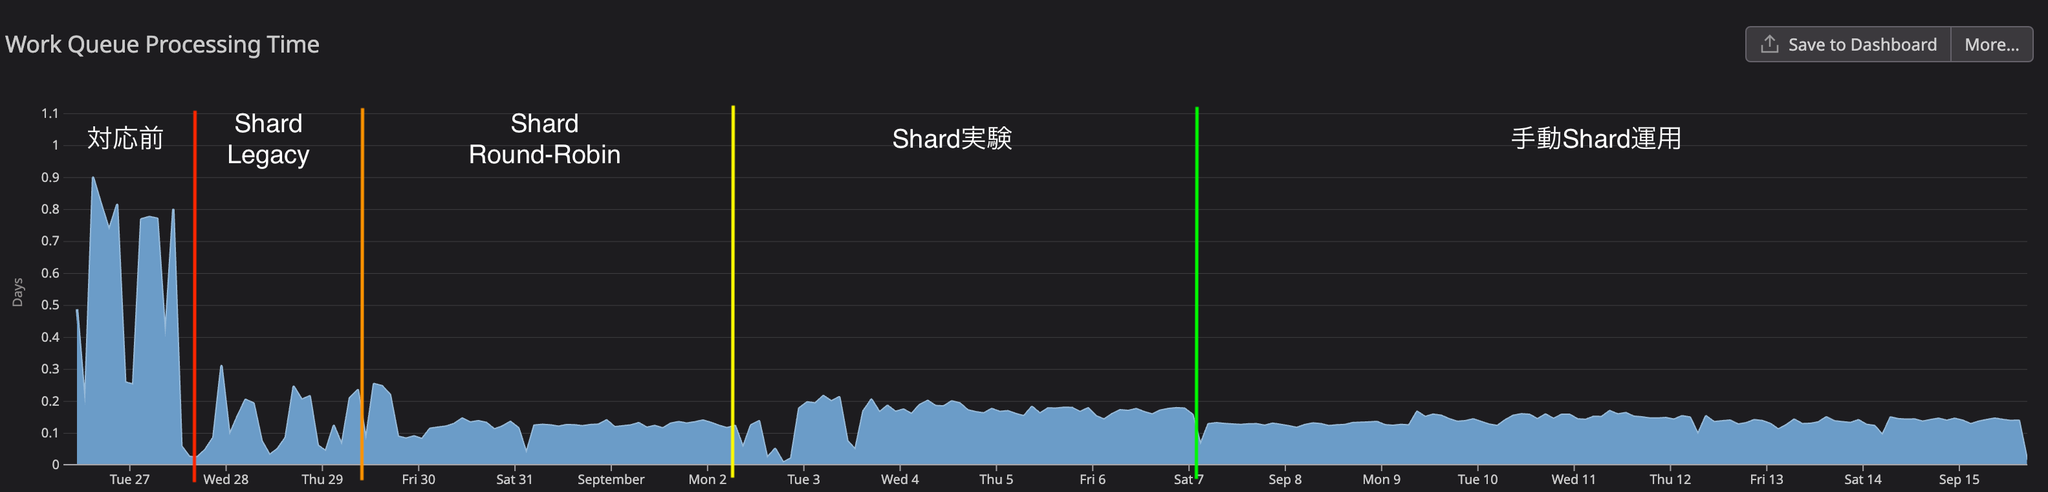
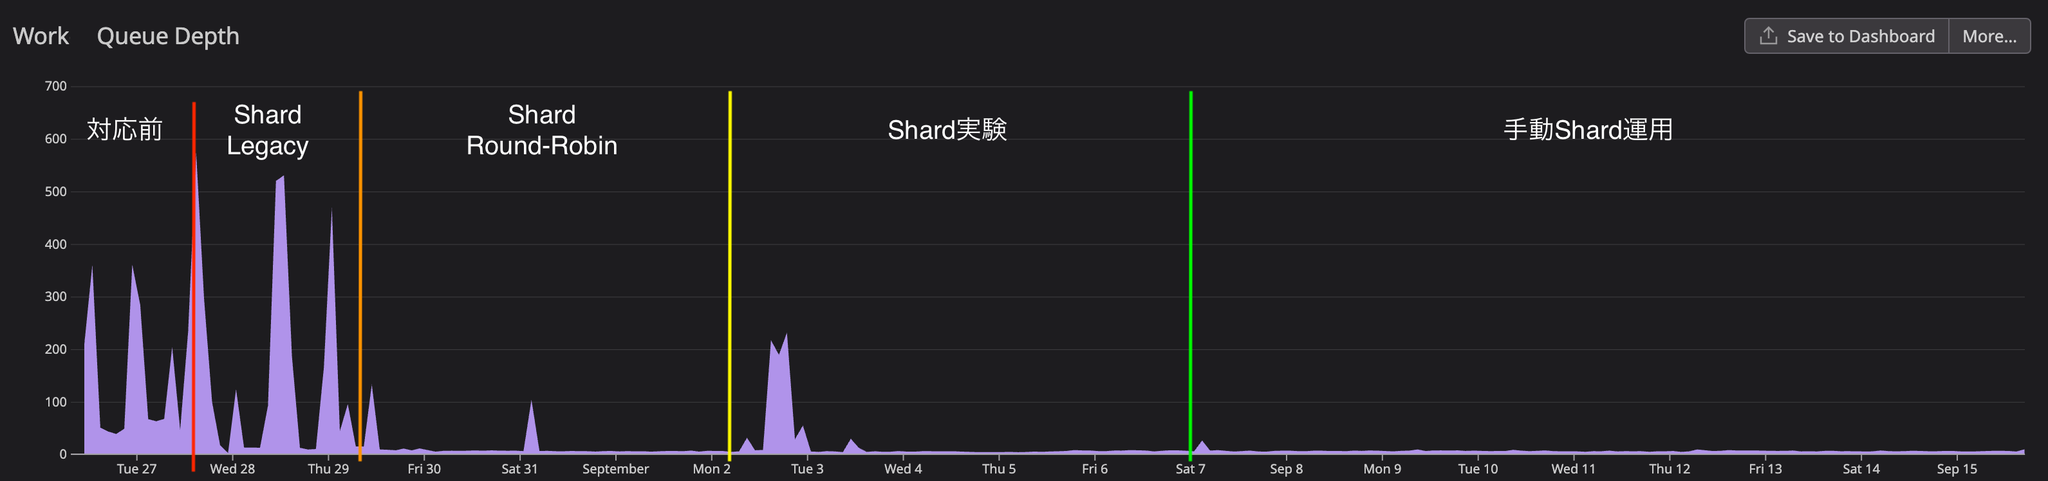
Prior to implementing corrective measures, we were analyzing the current situation while collecting metrics. CPU usage consistently remained above 1.8, and although sufficient memory was allocated, it was increasing to 4GB. The WorkQueue depth consistently remained above 100, reaching a peak of 350, and approaching that peak every two hours. We determined that the reason for the WorkQueue bottleneck was the long average processing time of the WorkQueue.
Shard activation first step
When Legacy Shard was enabled in v2.7, the initial switchover required a Controller restart, which temporarily increased the WorkQueue depth to 500. However, this gradually decreased as the Controller replica started up.
As a result, WorkQueue processing time was reduced by more than 60%, but significant fluctuations in processing time were observed because multiple clusters resided on the same shard. It was observed that processing time increased when multiple clusters started processing simultaneously, and decreased when there was no simultaneous processing.
Shard activation, second stage
Round-robinrepository i/o timeoutFurthermore, it was believed that the network environment was also a contributing factor, so we took measures to increase the number of retries.
Sharding experiment and application of optimal solution
Consistent-hashing ShardUnknownEven in applications with over 2000 resources, the sync process completed within one minute from start to finish, and all UI errors were resolved.
Regarding resource usage for each component, CPU usage remains stable at an average of 900MB and memory usage at 700MB, and overall performance remains calm even when numerous applications are being reconcile simultaneously.
Other adjustments
The following adjustments are not reflected in the graph analysis above because we did not set up a control experiment, but they helped to resolve some errors, so we list them here.
- Extension of the Reconcile period
Since reconcile every 3 minutes was not required for Product A, we extended the reconcile period to 5 minutes. In addition, we introduced jitter settings to reduce the load when multiple applications reconcile simultaneously. This will cause reconcile to occur randomly at intervals of 5m to (5m + 1m).
- Handling Helm/Kustomize and Monorepo
In Product A, the manifests for the product application are managed in a specific repository, and the manifests for applications managed by the operators are managed in a separate repository. Since both relies heavily on Kustomize and Helm, the Repo Server timeout was extended and parallel execution of Helm was allowed.
- Adjusting K8S_CLIENT_QPS/BURST
We have doubled the size of each of the Controller, Repo Server, and API Server.
UI performance
The following results were obtained when comparing the situation before the implementation of the improvement measures with the situation after manual sharding was implemented.
| Before improvement (FCP, LCP) | After improvement (FCP, LCP) | |
| Application list | 712ms, 1.8s | 562ms, 1.48s |
| Application details with 800+ resources | 820ms, 950ms | 778ms, 848ms |
| Application details with 2000+ resources | 645ms, 2.45s | 600ms, 1.12s |
Overall, improvements were observed ranging from 11% in FCP to up to 27% in LCP, although in some cases, LCP improved by more than 50% on specific pages.
During the period between 10 AM and 12 PM, when multiple developers were using the system simultaneously, we were only able to measure the pre-improvement data once, so we cannot provide precise figures. However, subjectively, we observed a significant improvement in performance.
However, in some applications with 2000+ resources, screen rendering lag persists, and the issue of the entire screen freezing, especially when opening resource details with a large amount of information, remains unresolved.
api/v1/stream/applications/<app_name>/resource-treeMany performance issues with the ArgoCD UI have been reported in GitHub Issues, with performance degradation being a particular concern when dealing with a large number of resources.
The most anticipated solution at the moment is server-side paging. While the roadmap indicates this issue will be addressed, it hasn't been implemented yet.
Problems with unmanaged resources
ArgoCD offers two main resource tracking methods: the Annotation method and the Label method.
In the default Label method, ArgoCD assigns labels to resources it manages, and the same labels are applied to Child resources created by those resources. This is how they are treated as managed resources of the ArgoCD Application. Product A presented at CNDT 2021 using Kubevela. This is a kind of follow-up story.
For example, in Product A, there is an ArgoCD application that manages more than 70 KubeVela applications, and the total number of resources generated by KubeVela exceeded 2500. In this case, significant delays occurred in ArgoCD's UI rendering speed and Controller reconcile processing, resulting in a noticeable performance degradation.
This resource management issue remains unresolved in Product A and continues to be a challenge.
In conclusion
Thank you for reading this far.
While ArgoCD is easy to use in its initial stages, the number of things to be mindful of increases as the number of applications grows. Fortunately, thanks to the active ArgoCD community, many performance-related parameters have been added in recent years. If I have the opportunity to contribute to ArgoCD in the future, I would definitely like to try it.
SRG is looking for new team members.
If you are interested, please contact us here.